Dietary Contributions of Food Outlets by Urbanization Level in the US Population 2 Years and Older, NHANES 2013–2018
Supporting Files

-
5 2023
-
File Language:
English
Details
-
Alternative Title:Am J Clin Nutr
-
Personal Author:
-
Description:Background:
Differences in food access, availability, affordability, and dietary intake are influenced by the food environment, which includes outlets where foods are obtained. These differences between food outlets within rural and urban food environments in the US are not well understood.
Objective:
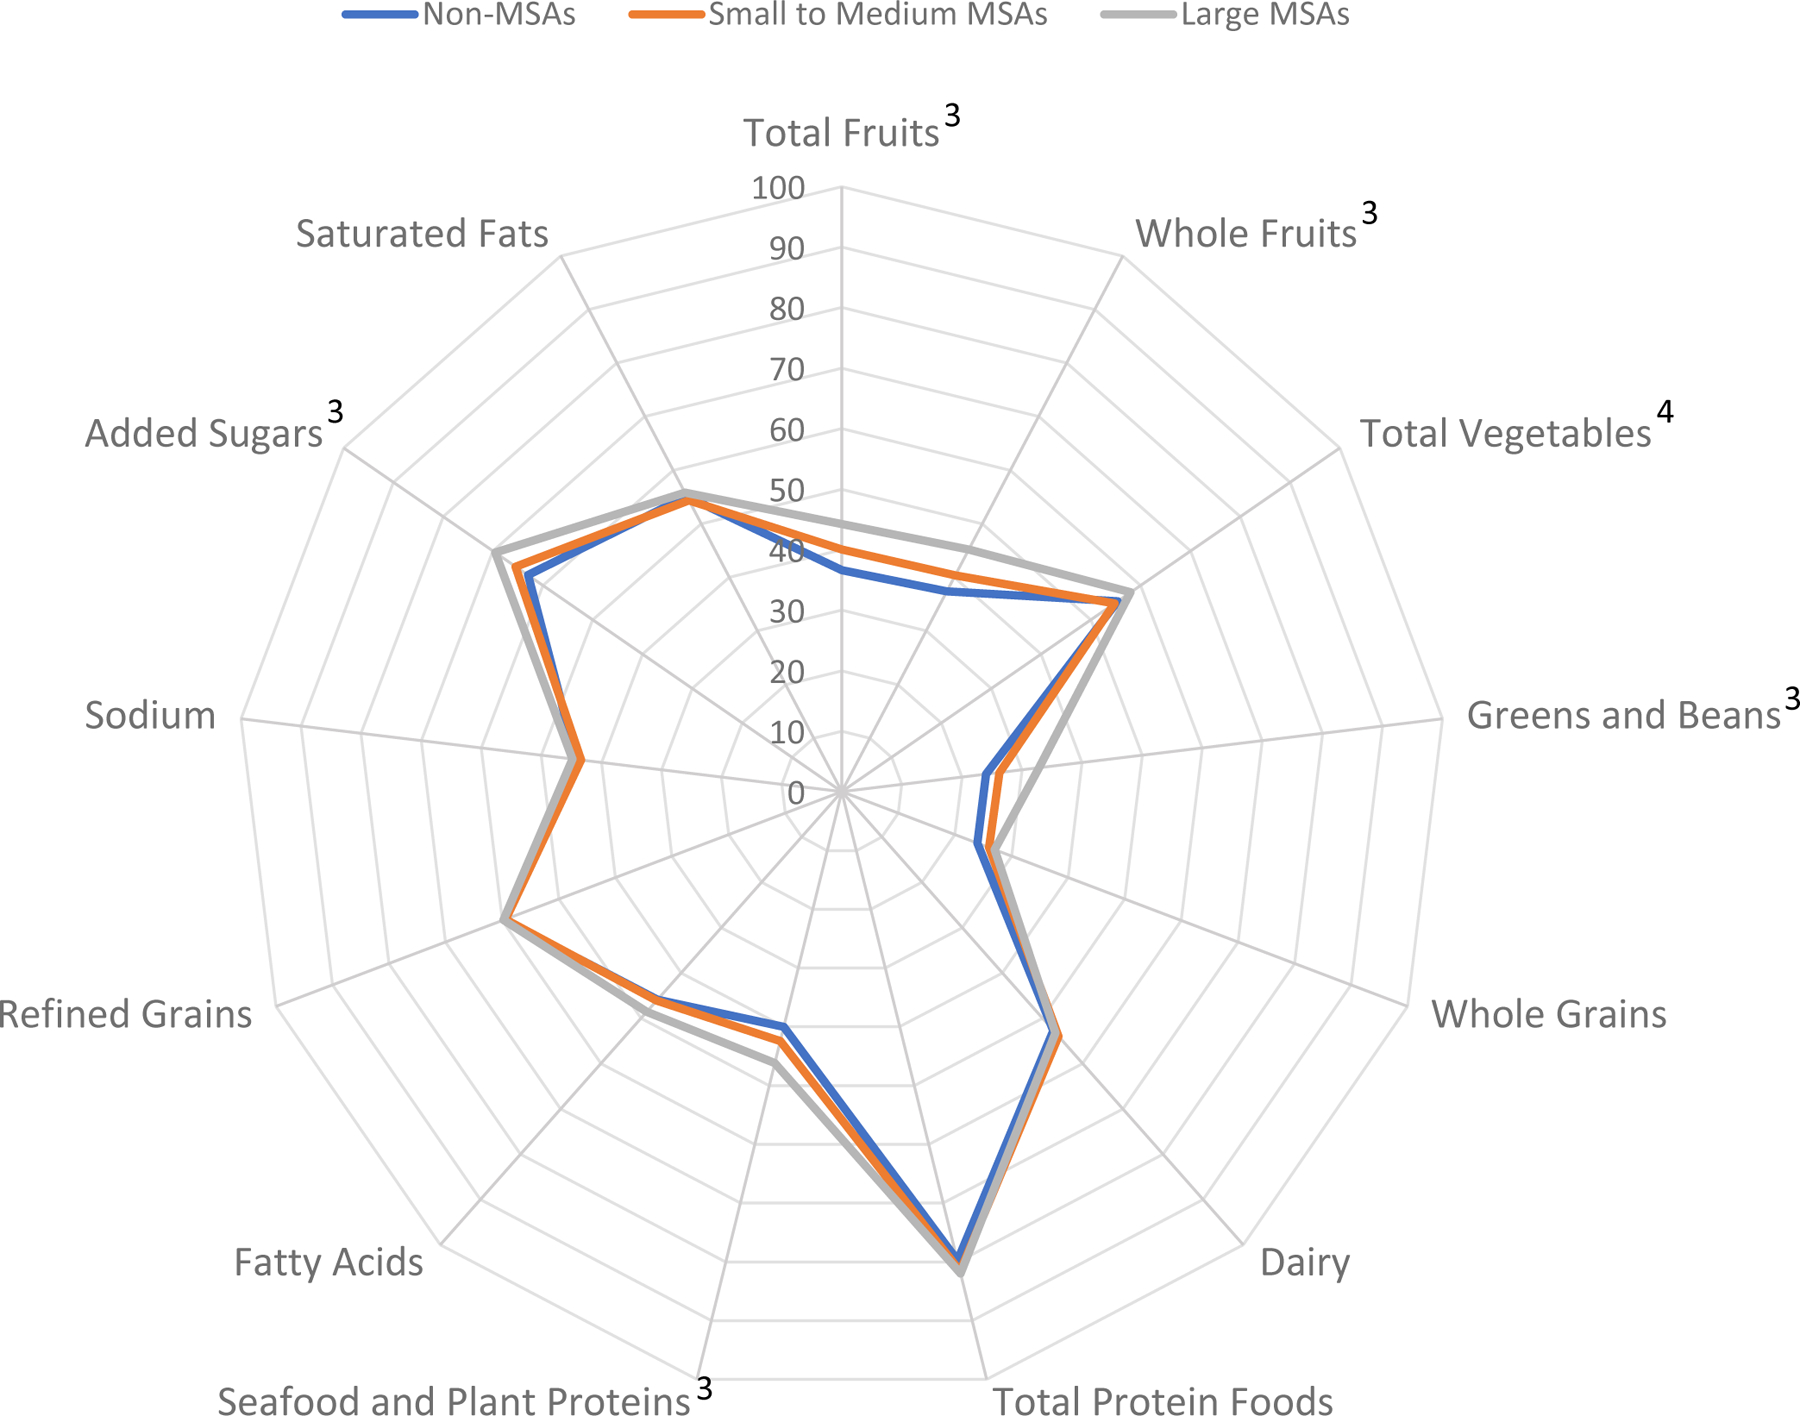
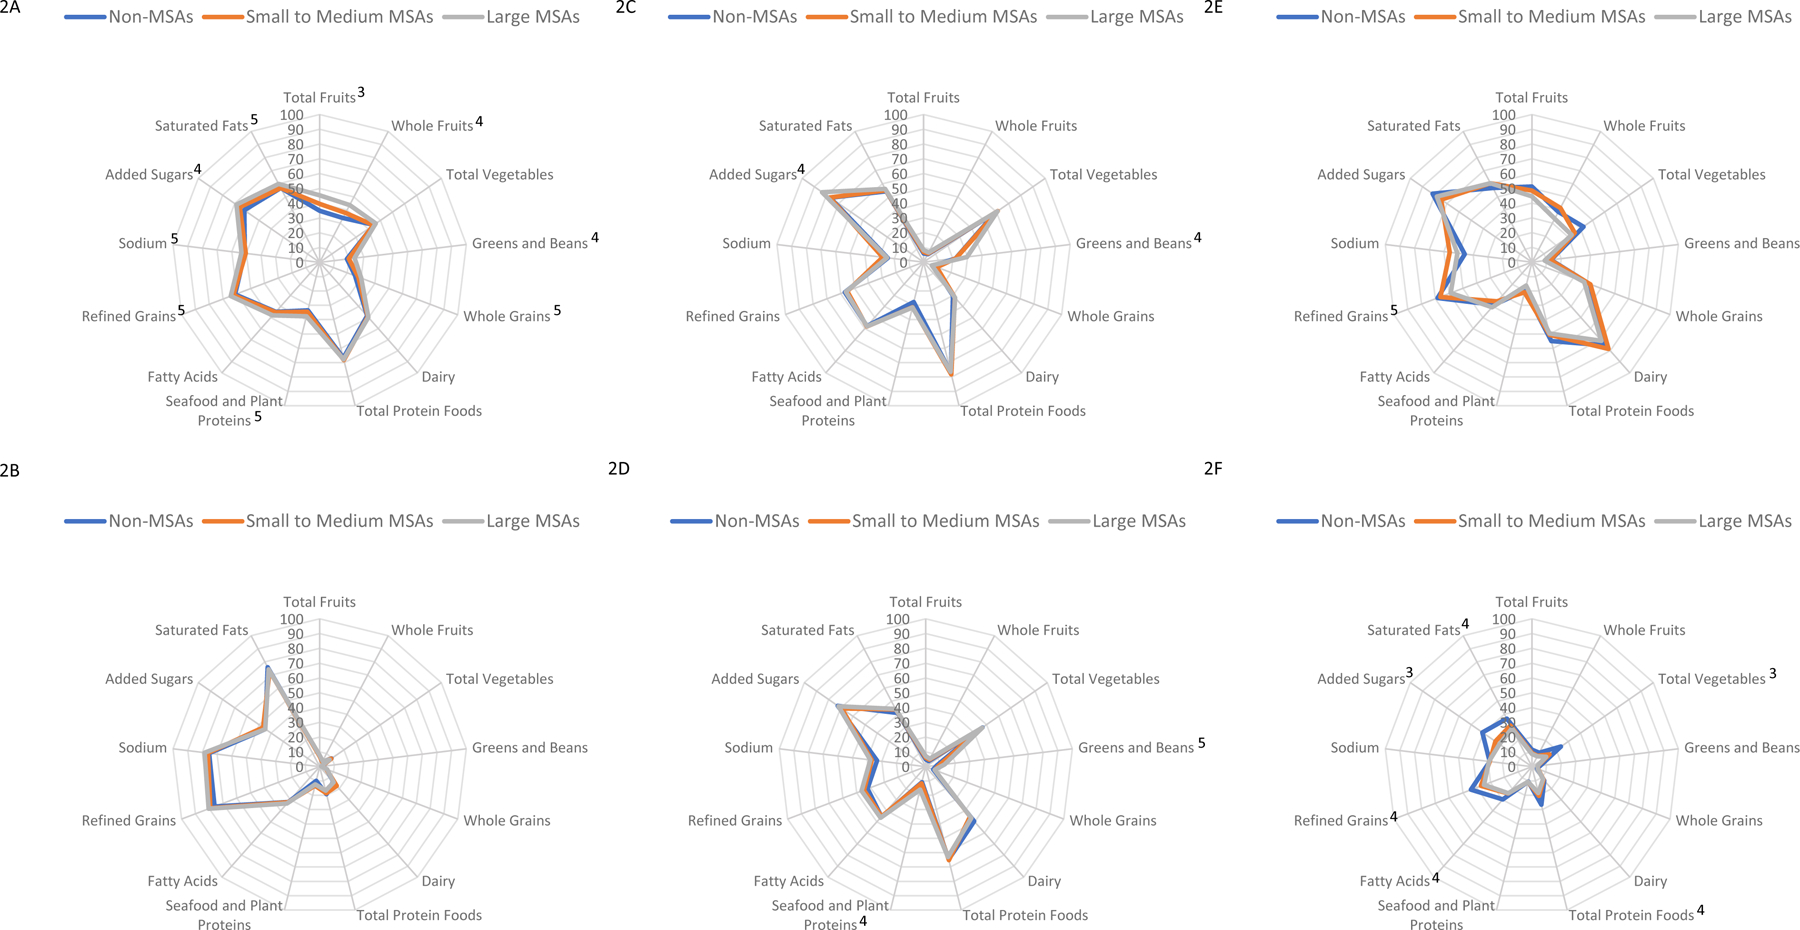
The aim of this analysis was to describe the contribution of foods and beverages from six outlets – grocery stores, convenience stores, full-service restaurants, quick-service restaurants, schools, and other outlets – to total energy intake and Healthy Eating Index (HEI)-2015 scores in the US population, by urbanization level (non-metropolitan statistical areas (MSA), small to medium MSA, and large MSA).
Design:
Data were from the National Health and Nutrition Examination Survey 2013–2018. Dietary intake from one 24-hour dietary recall was analyzed by the outlet where a food or beverage was obtained and by urbanization. Linear regression, adjusted for sex, age, race and Hispanic origin, and family income, was used to predict the contribution of each food outlet to total energy intake and HEI-2015 total and component scores by urbanization level.
Results:
During 2013–2018, foods and beverages from grocery stores, quick-service, and full-service restaurants provided 62.1%, 15.1% and 8.5% of energy intake, respectively. The percent of energy intake from full- and quick-service restaurants increased with increasing urbanization level. HEI-2015 total scores increased with increasing urbanization level overall (48.1 non-MSAs, 49.2 small to medium MSAs, and 51.3 large MSAs), for grocery stores (46.7 non-MSAs, 48.0 small to medium MSAs, and 50.6 large MSAs), and for quick-service restaurants (35.8 non-MSAs, 36.3 small to medium MSAs, and 37.5 large MSAs).
Conclusion:
Grocery stores and restaurants were the largest contributors of energy intake in urban and rural areas. Diet quality improved with increasing urbanization overall and for grocery stores and quick-service restaurants.
-
Subjects:
-
Keywords:
-
Source:Am J Clin Nutr. 117(5):946-954
-
Pubmed ID:36822405
-
Pubmed Central ID:PMC10159996
-
Document Type:
-
Funding:
-
Place as Subject:
-
Volume:117
-
Issue:5
-
Collection(s):
-
Main Document Checksum:urn:sha256:56a36b74151f0ae34ea5b1b6458a27b051528c232f87525ee688b7e879974f22
-
Download URL:
-
File Type:
 [PDF
- 524.51 KB
]
[PDF
- 524.51 KB
]
Supporting Files

File Language:
English
ON THIS PAGE

CDC STACKS serves as an archival repository of CDC-published products including
scientific findings,
journal articles, guidelines, recommendations, or other public health information authored or
co-authored by CDC or funded partners.
As a repository, CDC STACKS retains documents in their original published format to ensure public access to scientific information.
As a repository, CDC STACKS retains documents in their original published format to ensure public access to scientific information.
You May Also Like
COLLECTION
CDC Public Access