Characterizing the weight-glycemia phenotypes of type 1 diabetes in youth and young adulthood
Supporting Files

-
1 28 2020
-
File Language:
English
Details
-
Alternative Title:BMJ Open Diabetes Res Care
-
Personal Author:Kahkoska, Anna R ; Nguyen, Crystal T ; Jiang, Xiaotong ; Adair, Linda A ; Agarwal, Shivani ; Aiello, Allison E ; Burger, Kyle S ; Buse, John B ; Dabelea, Dana ; Dolan, Lawrence M ; Imperatore, Giuseppina ; Lawrence, Jean Marie ; Marcovina, Santica ; Pihoker, Catherine ; Reboussin, Beth A ; Sauder, Katherine A ; Kosorok, Michael R ; Mayer-Davis, Elizabeth J
-
Description:Introduction
Individuals with type 1 diabetes (T1D) present with diverse body weight status and degrees of glycemic control, which may warrant different treatment approaches. We sought to identify subgroups sharing phenotypes based on both weight and glycemia and compare characteristics across subgroups.
Research design and methods
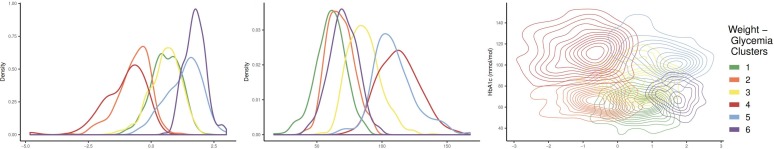
Participants with T1D in the SEARCH study cohort (n=1817, 6.0–30.4 years) were seen at a follow-up visit >5 years after diagnosis. Hierarchical agglomerative clustering was used to group participants based on five measures summarizing the joint distribution of body mass index z-score (BMIz) and hemoglobin A1c (HbA1c) which were estimated by reinforcement learning tree predictions from 28 covariates. Interpretation of cluster weight status and glycemic control was based on mean BMIz and HbA1c, respectively.
Results
The sample was 49.5% female and 55.5% non-Hispanic white (NHW); mean±SD age=17.6±4.5 years, T1D duration=7.8±1.9 years, BMIz=0.61±0.94, and HbA1c=76±21 mmol/mol (9.1±1.9)%. Six weight-glycemia clusters were identified, including four normal weight, one overweight, and one subgroup with obesity. No cluster had a mean HbA1c <58 mmol/mol (7.5%). Cluster 1 (34.0%) was normal weight with the lowest HbA1c and comprised 85% NHW participants with the highest socioeconomic position, insulin pump use, dietary quality, and physical activity. Subgroups with very poor glycemic control (ie, ≥108 mmol/mol (≥12.0%); cluster 4, 4.4%, and cluster 5, 7.5%) and obesity (cluster 6, 15.4%) had a lower proportion of NHW youth, lower socioeconomic position, and reported decreased pump use and poorer health behaviors (overall p<0.01). The overweight subgroup with very poor glycemic control (cluster 5) showed the highest lipids and blood pressure (p<0.01).
Conclusions
There are distinct subgroups of youth and young adults with T1D that share weight-glycemia phenotypes. Subgroups may benefit from tailored interventions addressing differences in clinical care, health behaviors, and underlying health inequity.
-
Subjects:
-
Source:BMJ Open Diabetes Res Care. 2020; 8(1)
-
Pubmed ID:32049631
-
Pubmed Central ID:PMC7039605
-
Document Type:
-
Funding:U01 DP000247/DP/NCCDPHP CDC HHSUnited States/ ; U18 DP002710/DP/NCCDPHP CDC HHSUnited States/ ; U18DP006138/ACL/ACL HHSUnited States/ ; F30 DK113728/DK/NIDDK NIH HHSUnited States/ ; U18 DP002714/DP/NCCDPHP CDC HHSUnited States/ ; U01 DP000244/DP/NCCDPHP CDC HHSUnited States/ ; UL1 TR000062/TR/NCATS NIH HHSUnited States/ ; U18DP006134/ACL/ACL HHSUnited States/ ; P30 DK020541/DK/NIDDK NIH HHSUnited States/ ; U18 DP002709/DP/NCCDPHP CDC HHSUnited States/ ; U18DP006131/ACL/ACL HHSUnited States/ ; P30 DK056350/DK/NIDDK NIH HHSUnited States/ ; UL1 TR000423/TR/NCATS NIH HHSUnited States/ ; HIR 10-001/HX/HSRD VAUnited States/ ; P30 DK057516/DK/NIDDK NIH HHSUnited States/ ; P30 ES010126/ES/NIEHS NIH HHSUnited States/ ; U18DP006139/ACL/ACL HHSUnited States/ ; UC4 DK108173/DK/NIDDK NIH HHSUnited States/ ; UL1 TR000154/TR/NCATS NIH HHSUnited States/ ; K23 DK115896/DK/NIDDK NIH HHSUnited States/ ; U01 DP000248/DP/NCCDPHP CDC HHSUnited States/ ; UL1 TR002489/TR/NCATS NIH HHSUnited States/ ; UL1 TR001425/TR/NCATS NIH HHSUnited States/ ; UL1 TR002319/TR/NCATS NIH HHSUnited States/ ; P60 DK020541/DK/NIDDK NIH HHSUnited States/ ; UL1 TR000077/TR/NCATS NIH HHSUnited States/ ; U18DP006136/ACL/ACL HHSUnited States/ ; U01 DP000250/DP/NCCDPHP CDC HHSUnited States/ ; U01 DP000246/DP/NCCDPHP CDC HHSUnited States/ ; U01 DP000254/DP/NCCDPHP CDC HHSUnited States/ ; U18DP006133/ACL/ACL HHSUnited States/ ; U18 DP002708/DP/NCCDPHP CDC HHSUnited States/
-
Volume:8
-
Issue:1
-
Collection(s):
-
Main Document Checksum:urn:sha256:fc0dfa4707e7f2f74b5046185f3d3664182c1cf07e7ebca4fe94cf04065ae726
-
Download URL:
-
File Type:
 [PDF
- 911.49 KB
]
[PDF
- 911.49 KB
]
Supporting Files

File Language:
English
ON THIS PAGE

CDC STACKS serves as an archival repository of CDC-published products including
scientific findings,
journal articles, guidelines, recommendations, or other public health information authored or
co-authored by CDC or funded partners.
As a repository, CDC STACKS retains documents in their original published format to ensure public access to scientific information.
As a repository, CDC STACKS retains documents in their original published format to ensure public access to scientific information.
You May Also Like
COLLECTION
CDC Public Access