Characterization of Lenticulostriate Arteries with High Resolution Black-blood T1-weighted Turbo Spin Echo with Variable Flip Angles at 3 and 7 Tesla
Supporting Files

-
May 31 2019
-
File Language:
English
Details
-
Alternative Title:Neuroimage
-
Personal Author:
-
Description:Objectives
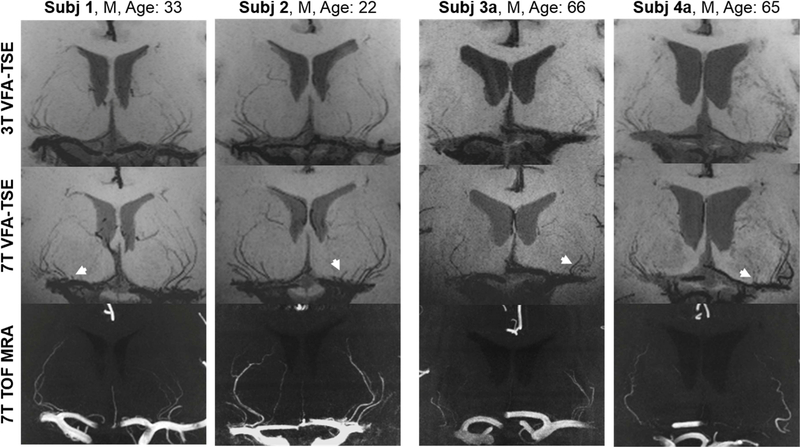
The lenticulostriate arteries (LSAs) with small diameters of a few hundred microns take origin directly from the high flow middle cerebral artery (MCA), making them especially susceptible to damage (e.g. by hypertension). This study aims to present high resolution (isotropic ~0.5 mm), black blood MRI for the visualization and characterization of LSAs at both 3T and 7T.
Materials and Methods
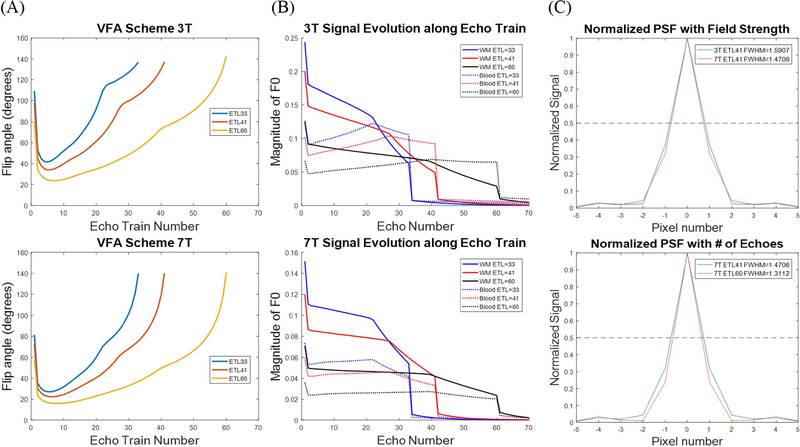
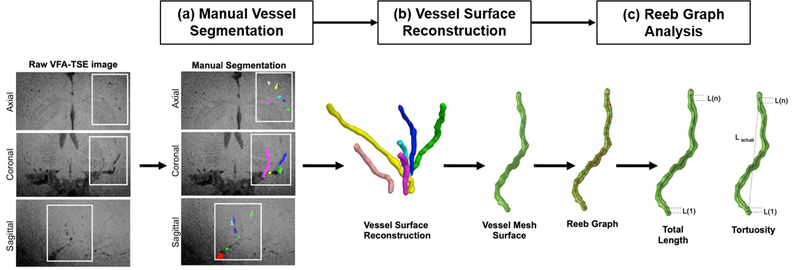
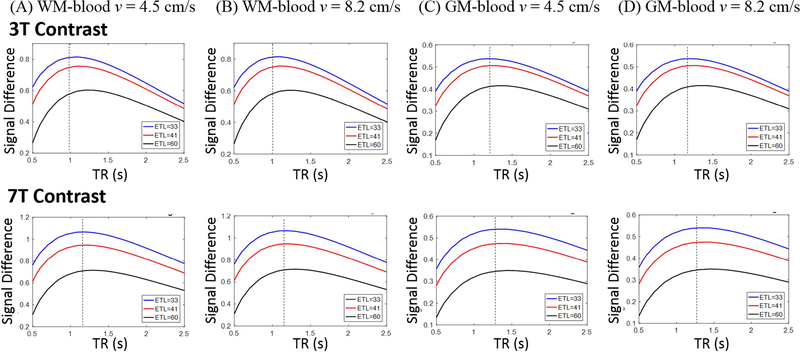
T1-weighted 3D turbo spin-echo with variable flip angles (T1w TSE-VFA) sequences were optimized for the visualization of LSAs by performing extended phase graph (EPG) simulations. Twenty healthy volunteers (15 under 35 years old, 5 over 60 years old) were imaged with the T1w TSE-VFA sequences at both 3T and 7T. Contrast-to-noise ratio (CNR) was quantified, and LSAs were manually segmented using ITK-SNAP. Automated Reeb graph shape analysis was performed to extract features including vessel length and tortuosity. All quantitative metrics were compared between the two field strengths and two age groups using ANOVA.
Results
LSAs can be clearly delineated using optimized 3D T1w TSE-VFA at 3T and 7T, and a greater number of LSA branches can be detected compared to those by time-of-flight MR angiography (TOF MRA) at 7T. The CNR of LSAs was comparable between 7T and 3T. T1w TSE-VFA showed significantly higher CNR than TOF MRA at the stem portion of the LSAs branching off the medial middle cerebral artery. The mean vessel length and tortuosity were greater on TOF MRA compared to TSE-VFA. The number of detected LSAs by both TSE-VFA and TOF MRA was significantly reduced in aged subjects, while the mean vessel length measured on 7T TSE-VFA showed significant difference between the two age groups.
Conclusion
The high-resolution black-blood 3D T1w TSE-VFA sequence offers a new method for the visualization and quantification of LSAs at both 3T and 7T, which may be applied for a number of pathological conditions related to the damage of LSAs.
-
Subjects:
-
Source:Neuroimage. 199:184-193
-
Pubmed ID:31158475
-
Pubmed Central ID:PMC6688958
-
Document Type:
-
Funding:P41 EB015922/EB/NIBIB NIH HHS/United States ; UH2 NS100614/NS/NINDS NIH HHS/United States ; S10 OD025312/OD/NIH HHS/United States ; S10 OD025312/CD/ODCDC CDC HHS/United States ; K25 AG056594/AG/NIA NIH HHS/United States ; UH3 NS100614/NS/NINDS NIH HHS/United States ; P01 AG052350/AG/NIA NIH HHS/United States
-
Volume:199
-
Collection(s):
-
Main Document Checksum:urn:sha256:613a143182763f5e30d9510af74cf0fe54851f93848ab71ad6e7af0b04cf2554
-
Download URL:
-
File Type:
 [PDF
- 1.60 MB
]
[PDF
- 1.60 MB
]
Supporting Files

File Language:
English
ON THIS PAGE

CDC STACKS serves as an archival repository of CDC-published products including
scientific findings,
journal articles, guidelines, recommendations, or other public health information authored or
co-authored by CDC or funded partners.
As a repository, CDC STACKS retains documents in their original published format to ensure public access to scientific information.
As a repository, CDC STACKS retains documents in their original published format to ensure public access to scientific information.
You May Also Like
COLLECTION
CDC Public Access