Quantifying spatial accessibility in public health practice and research: an application to on-premise alcohol outlets, United States, 2013
Supporting Files
Public Domain

-
Jun 27 2018
-
File Language:
English
Details
-
Alternative Title:Int J Health Geogr
-
Personal Author:
-
Description:Objective
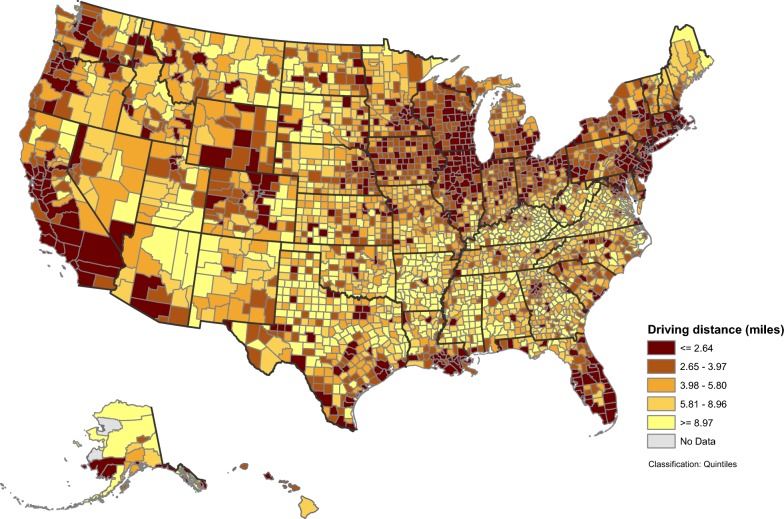
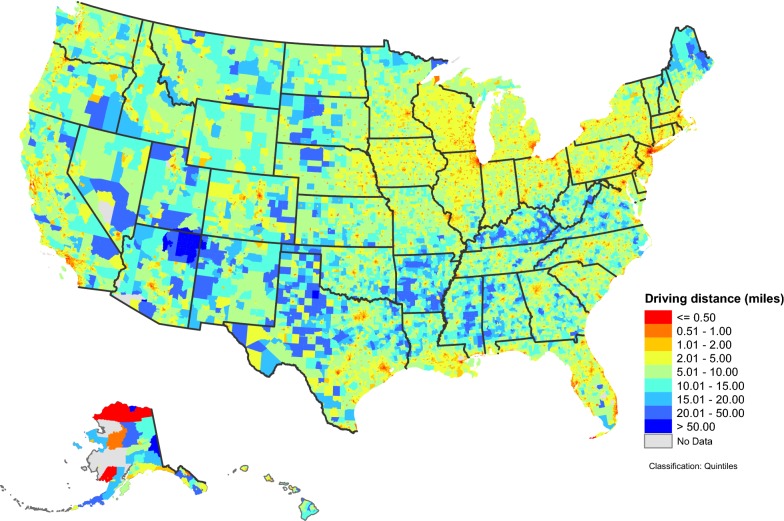
To assess spatial accessibility measures to on-premise alcohol outlets at census block, census tract, county, and state levels for the United States.
Methods
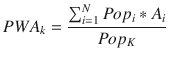
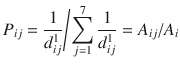
Using network analysis in a geographic information system, we computed distance-based measures (Euclidean distance, driving distance, and driving time) to on-premise alcohol outlets for the entire U.S. at the census block level. We then calculated spatial access-based measures, specifically a population-weighted spatial accessibility index and population-weighted distances (Euclidean distance, driving distance, and driving time) to alcohol outlets at the census tract, county, and state levels. A multilevel model-based sensitivity analysis was conducted to evaluate the associations between different on-premise alcohol outlet accessibility measures and excessive drinking outcomes.
Results
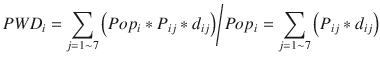
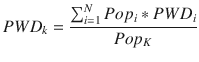
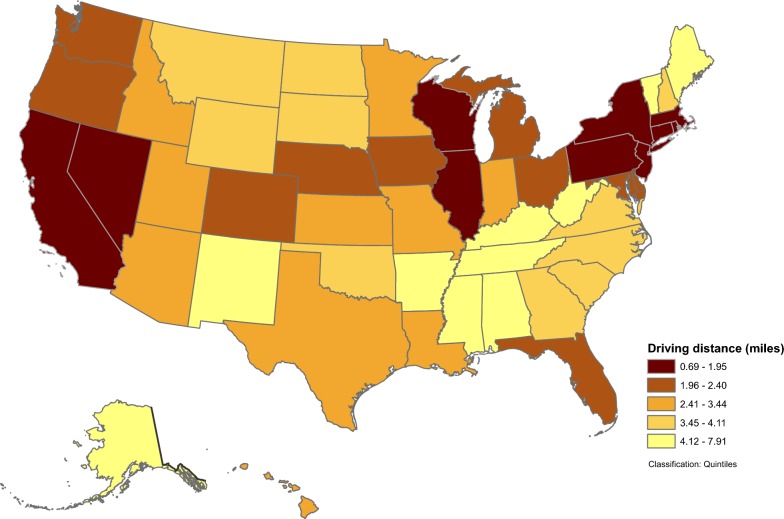
The national average population-weighted driving time to the nearest 7 on-premise alcohol outlets was 5.89 min, and the average population-weighted driving distance was 2.63 miles. At the state level, population-weighted driving times ranged from 1.67 min (DC) to 15.29 min (Arizona). Population-weighted driving distances ranged from 0.67 miles (DC) to 7.91 miles (Arkansas). At the county level, population-weighted driving times and distances exhibited significant geographic variations, and averages for both measures increased by the degree of county rurality. The population-weighted spatial accessibility indexes were highly correlated to respective population-weighted distance measures. Sensitivity analysis demonstrated that population weighted accessibility measures were more sensitive to excessive drinking outcomes than were population weighted distance measures.
Conclusions
These results can be used to assess the relationship between geographic access to on-premise alcohol outlets and health outcomes. This study demonstrates a flexible and robust method that can be applied or modified to quantify spatial accessibility to public resources such as healthy food stores, medical care providers, and parks and greenspaces, as well as, quantify spatial exposure to local adverse environments such as tobacco stores and fast food restaurants.
Electronic supplementary material
The online version of this article (10.1186/s12942-018-0143-y) contains supplementary material, which is available to authorized users.
-
Subjects:
-
Source:Int J Health Geogr. 17.
-
Pubmed ID:29945619
-
Pubmed Central ID:PMC6020393
-
Document Type:
-
Place as Subject:
-
Volume:17
-
Collection(s):
-
Main Document Checksum:urn:sha-512:229124f761bbbad4fbbc33b049832c2df96ad95324ccfaf9d30e59330d0ef4d1f144ba1c1c7fa77b46d74c3046fda845e2c46ec56ea4a3f2323a3706efb2a18c
-
Download URL:
-
File Type:
 [PDF
- 19.43 MB
]
[PDF
- 19.43 MB
]
Supporting Files

File Language:
English
ON THIS PAGE

CDC STACKS serves as an archival repository of CDC-published products including
scientific findings,
journal articles, guidelines, recommendations, or other public health information authored or
co-authored by CDC or funded partners.
As a repository, CDC STACKS retains documents in their original published format to ensure public access to scientific information.
As a repository, CDC STACKS retains documents in their original published format to ensure public access to scientific information.
You May Also Like
COLLECTION
CDC Public Access