Trends in PM2.5 emissions, concentrations and apportionments in Detroit and Chicago
Supporting Files

-
Mar 2016
Details
-
Alternative Title:Atmos Environ (1994)
-
Personal Author:
-
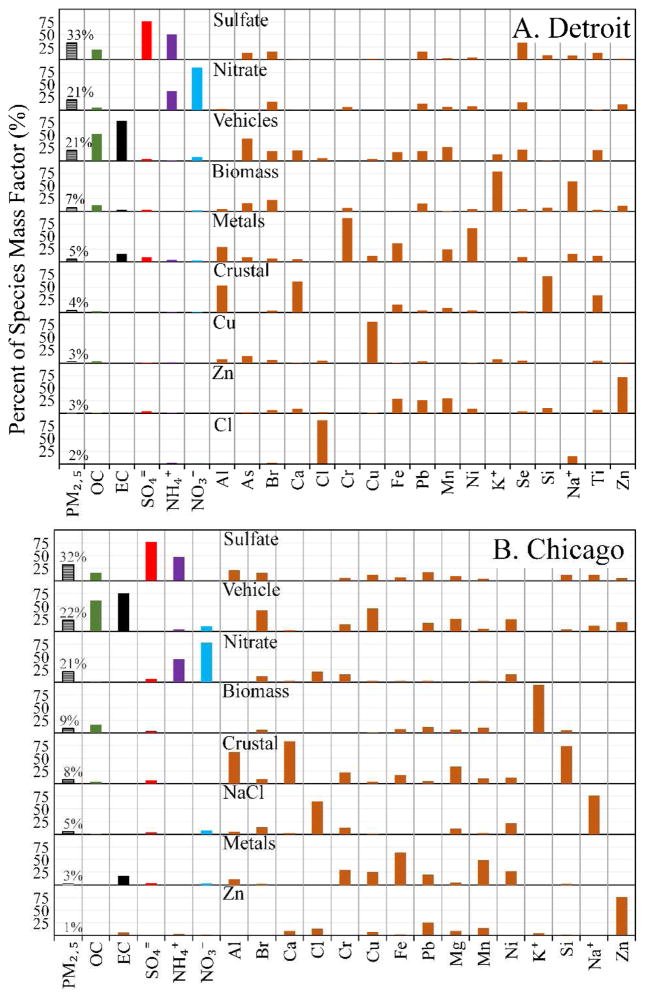
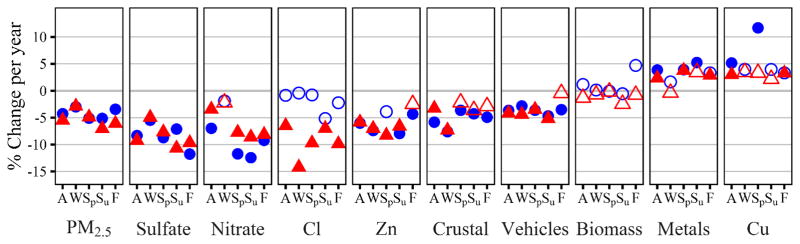
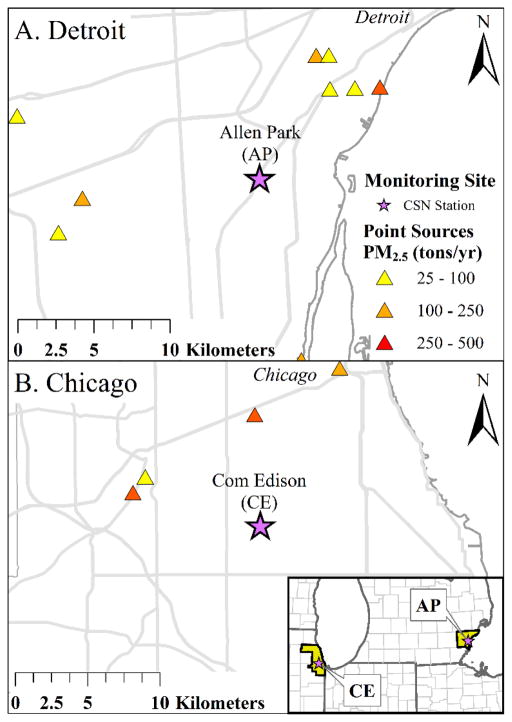
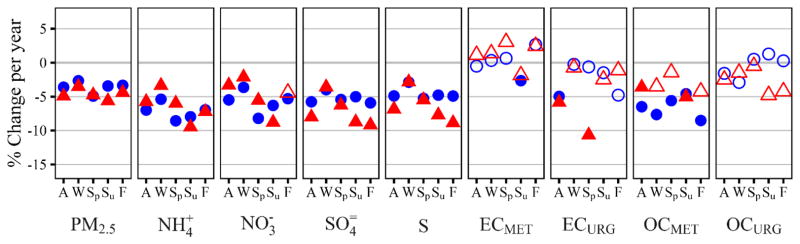
Description:PM2.5 concentrations throughout much of the U.S. have decreased over the last 15 years, but emissions and concentration trends can vary by location and source type. Such trends should be understood to inform air quality management and policies. This work examines trends in emissions, concentrations and source apportionments in two large Midwest U.S. cities, Detroit, Michigan, and Chicago, Illinois. Annual and seasonal trends were investigated using National Emission Inventory (NEI) data for 2002 to 2011, speciated ambient PM2.5 data from 2001 to 2014, apportionments from positive matrix factorization (PMF) receptor modeling, and quantile regression. Over the study period, county-wide data suggest emissions from point sources decreased (Detroit) or held constant (Chicago), while emissions from on-road mobile sources were constant (Detroit) or increased (Chicago), however changes in methodology limit the interpretation of inventory trends. Ambient concentration data also suggest source and apportionment trends, e.g., annual median concentrations of PM2.5 in the two cities declined by 3.2 to 3.6 %/yr (faster than national trends), and sulfate concentrations (due to coal-fired facilities and other point source emissions) declined even faster; in contrast, organic and elemental carbon (tracers of gasoline and diesel vehicle exhaust) declined more slowly or held constant. The PMF models identified nine sources in Detroit and eight in Chicago, the most important being secondary sulfate, secondary nitrate and vehicle emissions. A minor crustal dust source, metals sources, and a biomass source also were present in both cities. These apportionments showed that the median relative contributions from secondary sulfate sources decreased by 4.2 to 5.5% per year in Detroit and Chicago, while contributions from metals sources, biomass sources, and vehicles increased from 1.3 to 9.2% per year. This first application of quantile regression to trend analyses of speciated PM2.5 data reveals that source contributions to PM2.5 varied as PM2.5 concentrations decreased, and that the fraction of PM2.5 due to emissions from vehicles and other local emissions has increased. Each data source has uncertainties, but emissions, monitoring and PMF data provide complementary information that can help to discern trends and identify contributing sources. Study results emphasize the need to target specific sources in policies and regulations aimed at decreasing PM2.5 concentrations in urban areas.
-
Subjects:
-
Source:Atmos Environ (1994). 129:197-209.
-
Pubmed ID:28936112
-
Pubmed Central ID:PMC5603263
-
Document Type:
-
Funding:
-
Volume:129
-
Collection(s):
-
Main Document Checksum:urn:sha256:befe3f3cfd029e01efadbb53bf95ac96a3dab77d41eec406d798e358614c8414
-
Download URL:
-
File Type:
 [PDF
- 1.46 MB
]
[PDF
- 1.46 MB
]
Supporting Files

ON THIS PAGE

CDC STACKS serves as an archival repository of CDC-published products including
scientific findings,
journal articles, guidelines, recommendations, or other public health information authored or
co-authored by CDC or funded partners.
As a repository, CDC STACKS retains documents in their original published format to ensure public access to scientific information.
As a repository, CDC STACKS retains documents in their original published format to ensure public access to scientific information.
You May Also Like
COLLECTION
CDC Public Access