CDC STACKS serves as an archival repository of CDC-published products including scientific findings, journal articles, guidelines, recommendations, or other public health information authored or co-authored by CDC or funded partners.
As a repository, CDC STACKS retains documents in their original published format to ensure public access to scientific information.
i
Incidence and Characteristics of Ventilator-Associated Events Reported to the National Healthcare Safety Network in 2014*
-
Dec 2016
-
-
Source: Crit Care Med. 2016; 44(12):2154-2162.
Details:
-
Alternative Title:Crit Care Med
-
Personal Author:
-
Description:Objective:
Ventilator-associated event surveillance was introduced in the National Healthcare Safety Network in 2013, replacing surveillance for ventilator-associated pneumonia in adult inpatient locations. We determined incidence rates and characteristics of ventilator-associated events reported to the National Healthcare Safety Network.
Design, Setting, and Patients:
We analyzed data reported from U.S. healthcare facilities for ventilator-associated events that occurred in 2014, the first year during which ventilator-associated event surveillance definitions were stable. We used negative binomial regression modeling to identify healthcare facility and inpatient location characteristics associated with ventilator-associated events. We calculated ventilator-associated event incidence rates, rate distributions, and ventilator utilization ratios in critical care and noncritical care locations and described event characteristics.
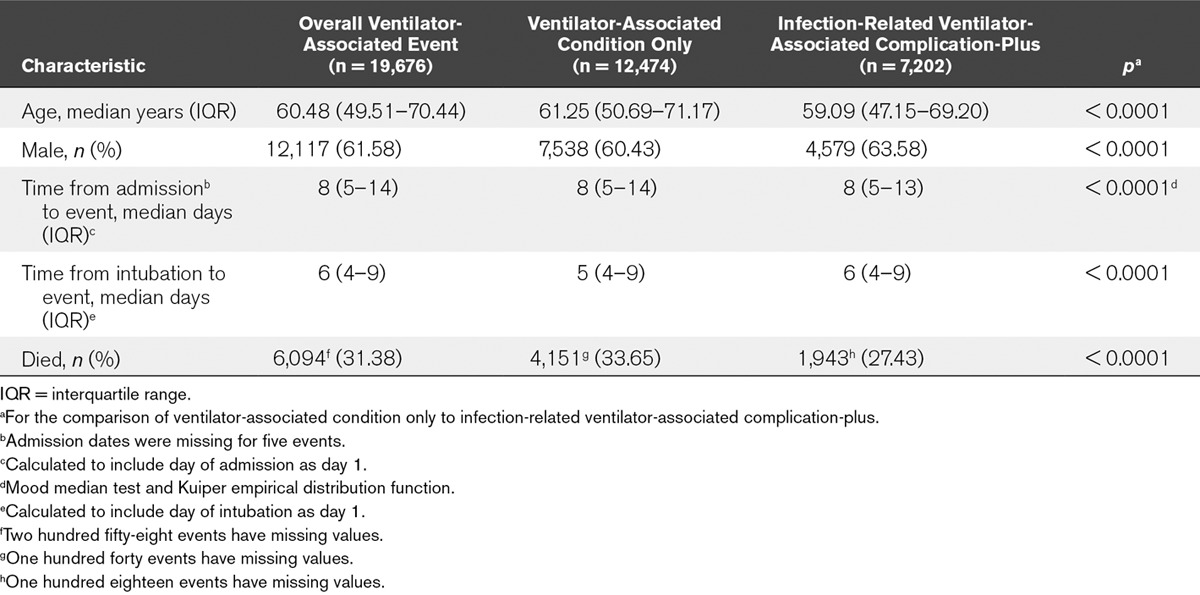
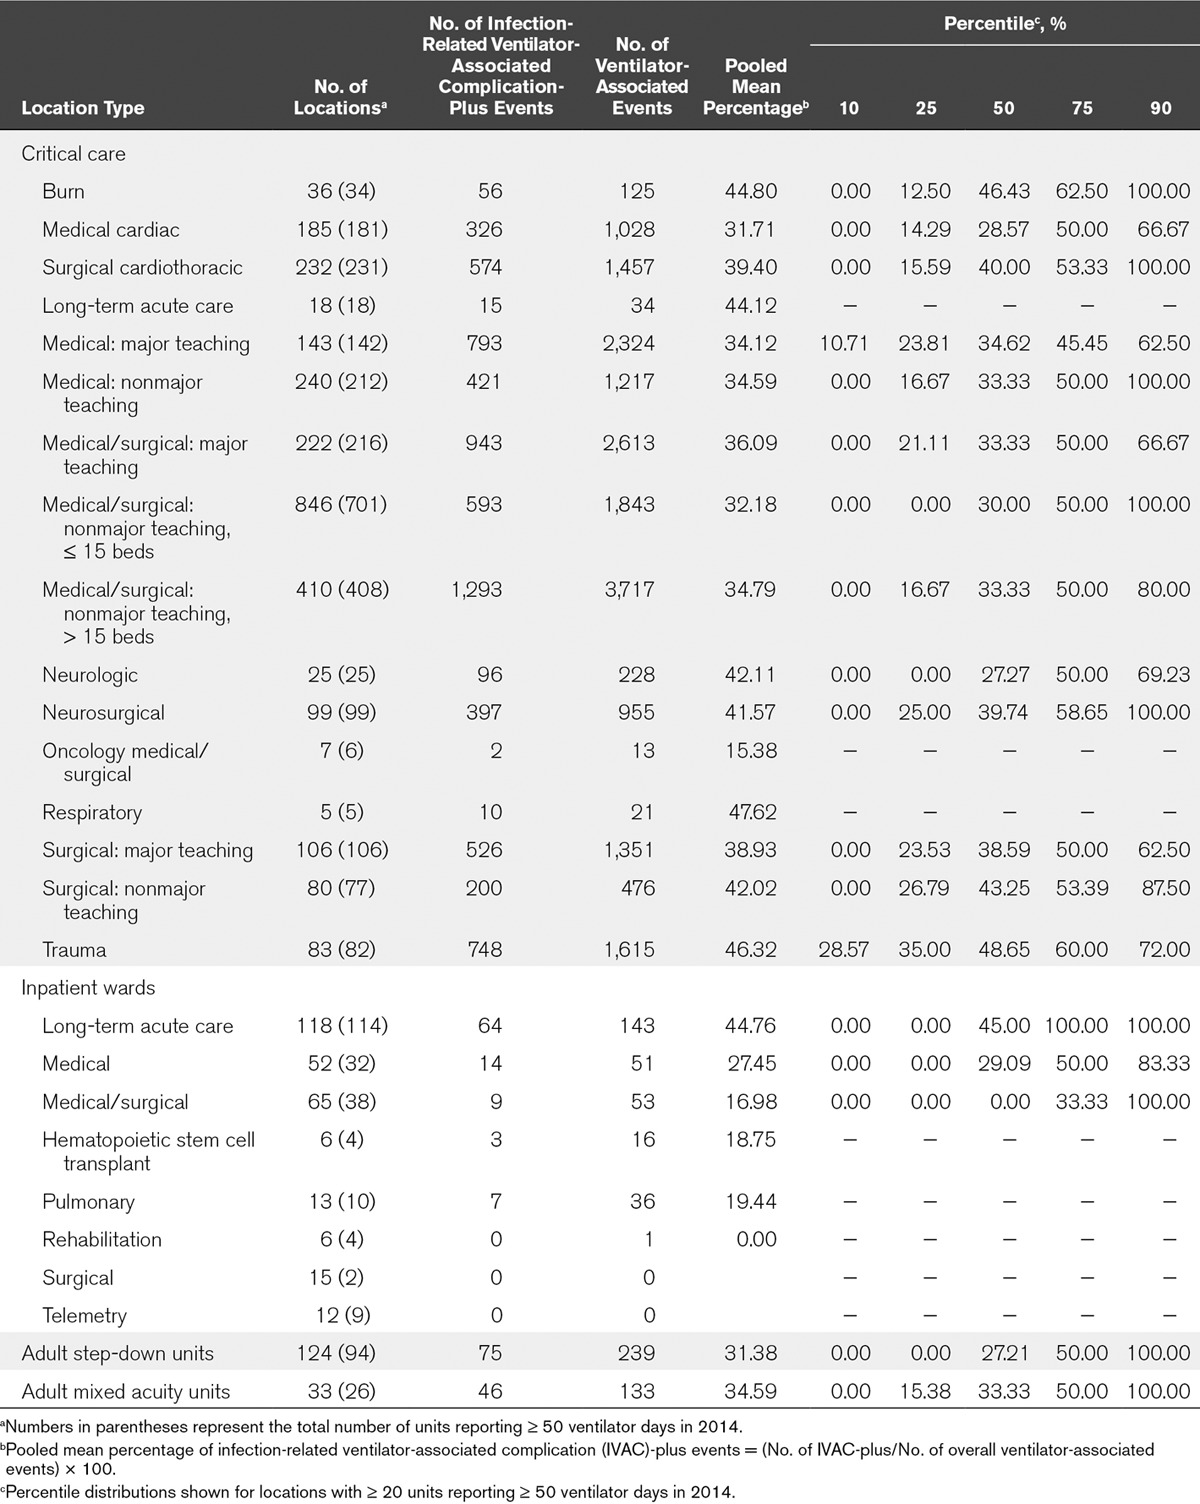
Measurements and Main Results:
A total of 1,824 healthcare facilities reported 32,772 location months of ventilator-associated event surveillance data to the National Healthcare Safety Network in 2014. Critical care unit pooled mean ventilator-associated event incidence rates ranged from 2.00 to 11.79 per 1,000 ventilator days, whereas noncritical care unit rates ranged from 0 to 14.86 per 1,000 ventilator days. The pooled mean proportion of ventilator-associated events defined as infection-related varied from 15.38% to 47.62% in critical care units. Pooled mean ventilator utilization ratios in critical care units ranged from 0.24 to 0.47.
Conclusions:
We found substantial variability in ventilator-associated event incidence, proportions of ventilator-associated events characterized as infection-related, and ventilator utilization within and among location types. More work is needed to understand the preventable fraction of ventilator-associated events and identify patient care strategies that reduce ventilator-associated events.
-
Subjects:
-
Source:
-
Pubmed ID:27513356
-
Pubmed Central ID:PMC5113232
-
Document Type:
-
Volume:44
-
Issue:12
-
Collection(s):
-
Main Document Checksum:
-
Download URL:
-
File Type:
 [PDF-552.73 KB]


