Spending by California's Department of Developmental Services for Persons with Autism across Demographic and Expenditure Categories
Supporting Files

-
2016/03/25
-
File Language:
English
Details
-
Journal Article:PLoS One
-
Personal Author:
-
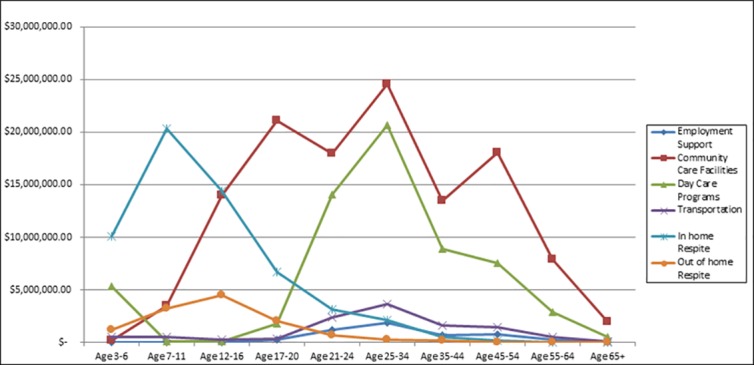
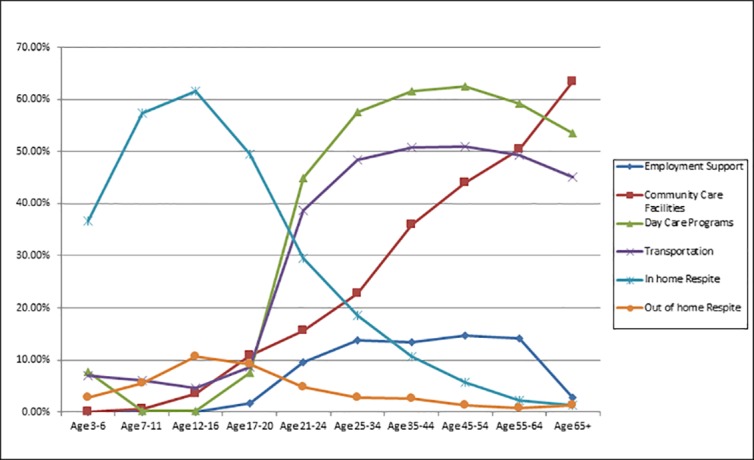
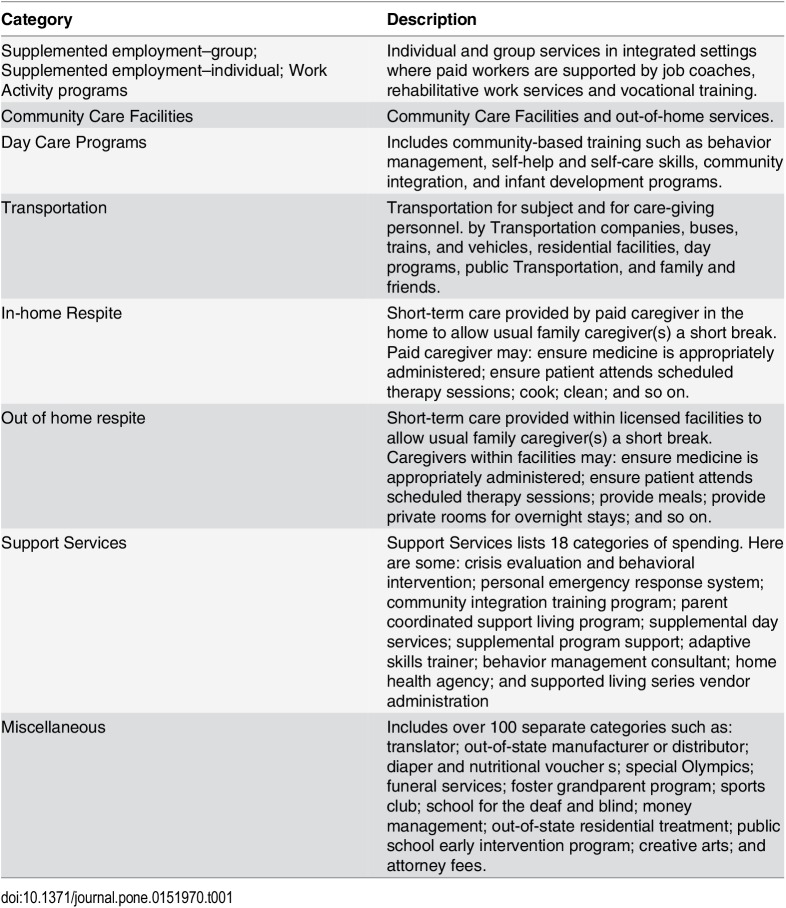
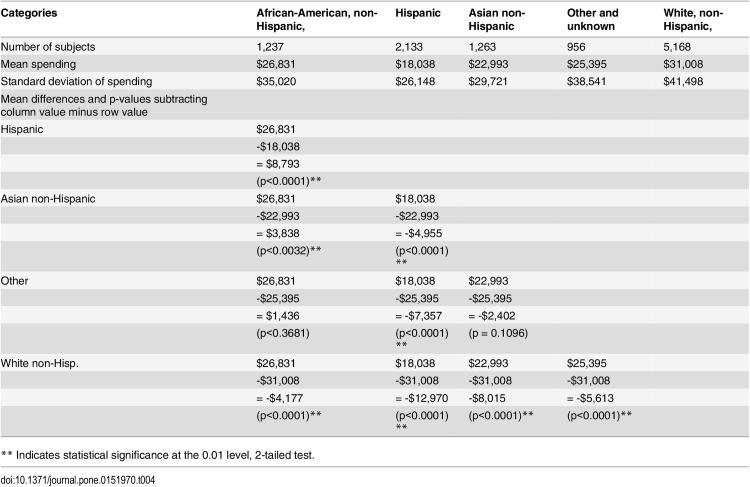
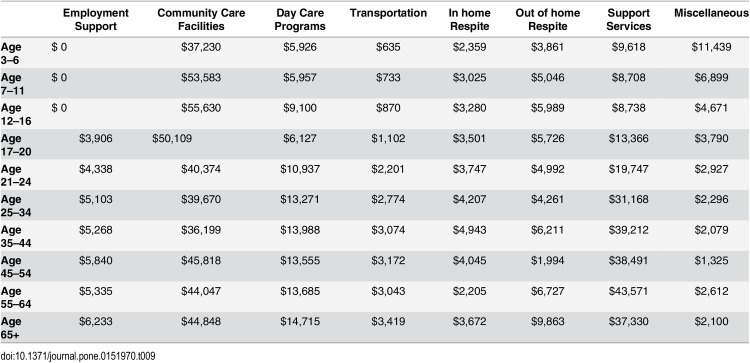
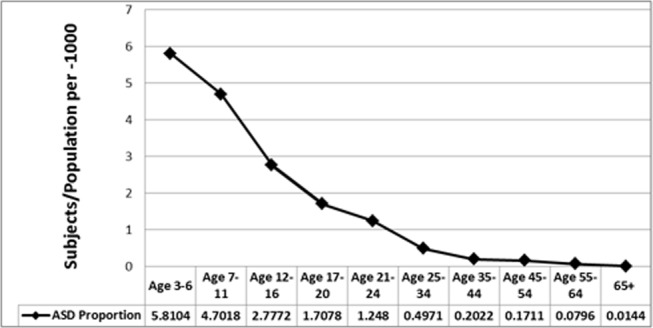
Description:BACKGROUND: Few autism spectrum disorder (ASD) studies have estimated non-medical costs for treatment or addressed possible differences in provision of services across gender, race-ethnic, age or demographic or expenditure categories, especially among adults. METHODS: The California Department of Developmental Services (CDDS) provides services to residents with developmental disabilities. CDDS provided aggregate data on primarily non-medical spending for fiscal year 2012-2013 for persons with ASD with or without intellectual disability (ID) (main sample, n = 42,274), and two sub-samples: ASD only (n = 30,164), and ASD+ID (n = 12,110). Demographic variables included sex, age and race-ethnicity. Spending categories included Employment Support, Community Care Facilities, Day Care, Transportation, and in-home and out-of-home Respite. RESULTS: Per-person spending for males and females were approximately the same: $10,488 and $10,791 for males and females for ages 3-17 and $26,491 and $26,627 for ages 18+. Among race/ethnicity categories, the ranking from highest to lowest among ages 3-17 was white non-Hispanics ($11,480), Asian non-Hispanics ($11,036), "Others" ($11,031), Hispanics ($9,571), and African-American non-Hispanics ($9,482). For ages 18+, the ranking was whites ($31,008), African-Americans ($26,831), "Others" ($25,395), Asians ($22,993), and Hispanics ($18,083). The ASD+ID sub-sample exerted disproportionate influence on findings from the main sample for persons 18+. Combining all ages, the top two expenditure categories for per-person spending were Community Care Facilities ($43,867) and Day Care ($11,244). For most adult age groups, the percentage of recipients participating were highest for Day Care (44.9% - 62.4%) and Transportation (38.6% - 50.9%). Per-person spending for Day Care, Transportation, and Employment Support was relatively low for children but relatively high for adults. CONCLUSION: White non-Hispanics received the highest per-person spending and Hispanics among the least. Amounts within spending categories varied considerably across age groups. Our estimates may be useful as baseline measures for stakeholders preparing for increasing ASD prevalence, especially among adults. [Description provided by NIOSH]
-
Subjects:
-
Keywords:
-
Source:PLoS One 2016 Mar; 11(3):e0151970
-
ISSN:1932-6203
-
Pubmed ID:27015098
-
Pubmed Central ID:PMC4807877
-
Document Type:
-
Funding:
-
Genre:
-
Place as Subject:
-
CIO:
-
Topic:
-
Location:
-
Pages in Document:23 pdf pages
-
Volume:11
-
Issue:3
-
NIOSHTIC Number:nn:20048537
-
Email:pleigh@ucdavis.edu
-
Federal Fiscal Year:2016
-
NORA Priority Area:
-
Performing Organization:University of California - Davis
-
Peer Reviewed:True
-
Collection(s):
-
Main Document Checksum:urn:sha-512:410491172c6cd31e98f6372a8237ffc1cc1f31326596eaed424f0288828e225a499eafdc0b0c14daa80c002dd98191b352f26be9b78cfce0d84d777af4db65ac
-
Download URL:
-
File Type:
 [PDF
- 600.30 KB
]
[PDF
- 600.30 KB
]
Supporting Files

File Language:
English
ON THIS PAGE

CDC STACKS serves as an archival repository of CDC-published products including
scientific findings,
journal articles, guidelines, recommendations, or other public health information authored or
co-authored by CDC or funded partners.
As a repository, CDC STACKS retains documents in their original published format to ensure public access to scientific information.
As a repository, CDC STACKS retains documents in their original published format to ensure public access to scientific information.
You May Also Like