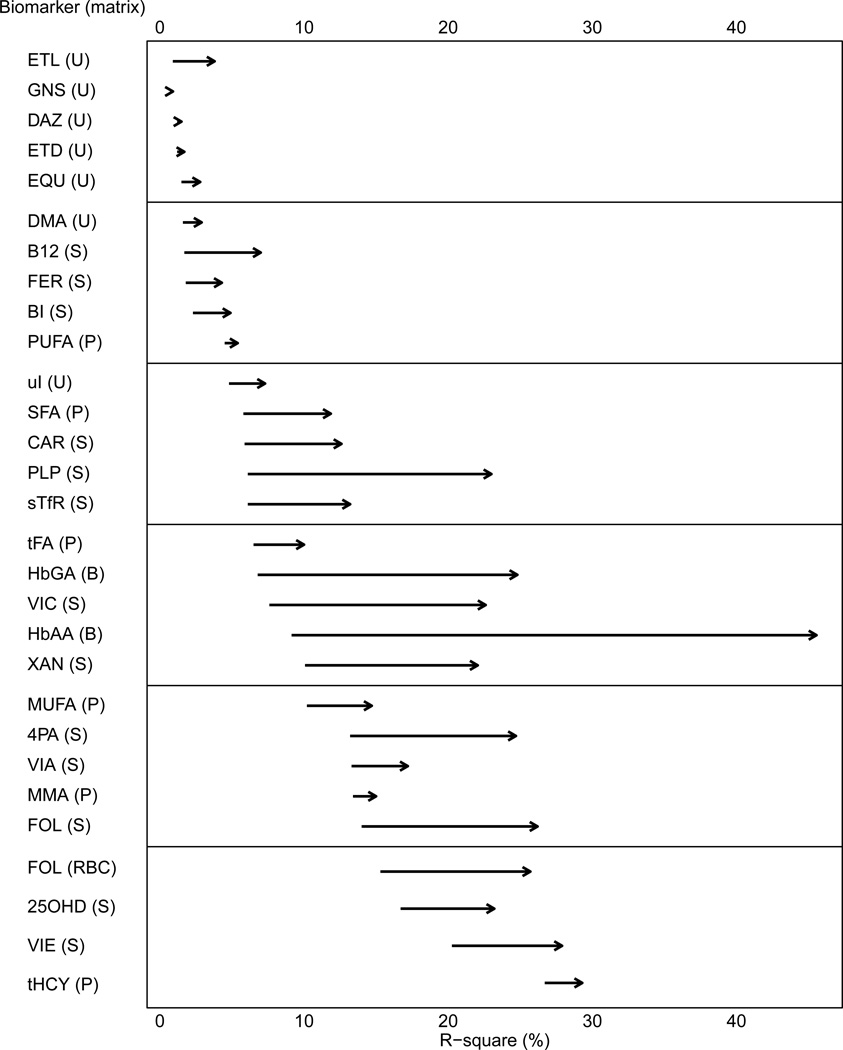
Regression modeling plan for twenty-nine biochemical indicators of diet and nutrition measured in NHANES 2003–20061–3
Supporting Files

-
6 2013
File Language:
English
Details
-
Alternative Title:J Nutr
-
Personal Author:
-
Description:The collection of articles in this supplement issue provides insight into the association of various covariates with concentrations of biochemical indicators of diet and nutrition (biomarkers), beyond age, race, and sex, using linear regression. We studied 10 specific sociodemographic and lifestyle covariates in combination with 29 biomarkers from NHANES 2003-2006 for persons aged ≥ 20 y. The covariates were organized into 2 sets or "chunks": sociodemographic (age, sex, race-ethnicity, education, and income) and lifestyle (dietary supplement use, smoking, alcohol consumption, BMI, and physical activity) and fit in hierarchical fashion by using each category or set of related variables to determine how covariates, jointly, are related to biomarker concentrations. In contrast to many regression modeling applications, all variables were retained in a full regression model regardless of significance to preserve the interpretation of the statistical properties of β coefficients, P values, and CIs and to keep the interpretation consistent across a set of biomarkers. The variables were preselected before data analysis, and the data analysis plan was designed at the outset to minimize the reporting of false-positive findings by limiting the amount of preliminary hypothesis testing. Although we generally found that demographic differences seen in biomarkers were over- or underestimated when ignoring other key covariates, the demographic differences generally remained significant after adjusting for sociodemographic and lifestyle variables. These articles are intended to provide a foundation to researchers to help them generate hypotheses for future studies or data analyses and/or develop predictive regression models using the wealth of NHANES data.
-
Subjects:
-
Source:J Nutr. 143(6):948S-956S
-
Pubmed ID:23596165
-
Pubmed Central ID:PMC4811339
-
Document Type:
-
Funding:
-
Volume:143
-
Issue:6
-
Collection(s):
-
Main Document Checksum:urn:sha256:a582ea9267d3d10a1be3021cf0082017b6c3fe8614a296fc2ce0f9776f5ede52
-
Download URL:
-
File Type:
 [PDF
- 724.18 KB
]
[PDF
- 724.18 KB
]
Supporting Files

File Language:
English
ON THIS PAGE

CDC STACKS serves as an archival repository of CDC-published products including
scientific findings,
journal articles, guidelines, recommendations, or other public health information authored or
co-authored by CDC or funded partners.
As a repository, CDC STACKS retains documents in their original published format to ensure public access to scientific information.
As a repository, CDC STACKS retains documents in their original published format to ensure public access to scientific information.
You May Also Like
COLLECTION
CDC Public Access