Web-based public health geographic information systems for resources-constrained environment using scalable vector graphics technology: a proof of concept applied to the expanded program on immunization data
Supporting Files
Public Domain

-
Jun 03 2006
Details
-
Alternative Title:Int J Health Geogr
-
Personal Author:
-
Description:Background
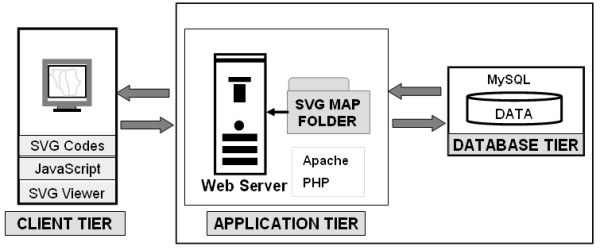
Geographic Information Systems (GIS) are powerful communication tools for public health. However, using GIS requires considerable skill and, for this reason, is sometimes limited to experts. Web-based GIS has emerged as a solution to allow a wider audience to have access to geospatial information. Unfortunately the cost of implementing proprietary solutions may be a limiting factor in the adoption of a public health GIS in a resource-constrained environment. Scalable Vector Graphics (SVG) is used to define vector-based graphics for the internet using XML (eXtensible Markup Language); it is an open, platform-independent standard maintained by the World Wide Web Consortium (W3C) since 2003. In this paper, we summarize our methodology and demonstrate the potential of this free and open standard to contribute to the dissemination of Expanded Program on Immunization (EPI) information by providing interactive maps to a wider audience through the Internet.
Results
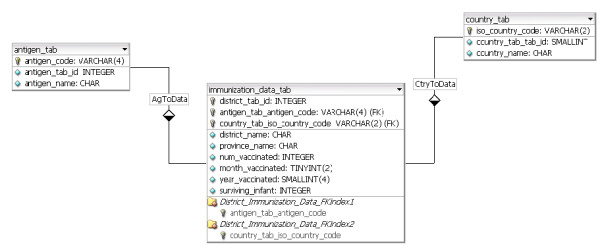
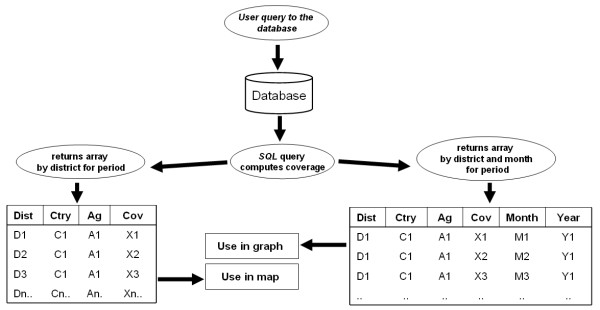
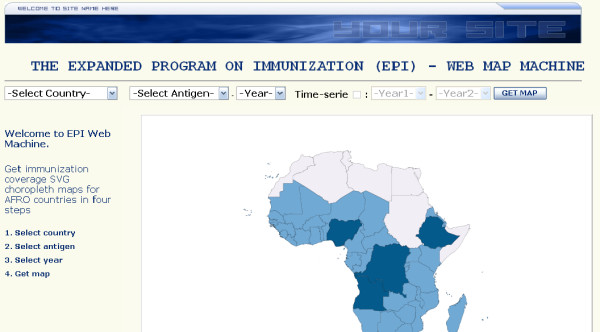
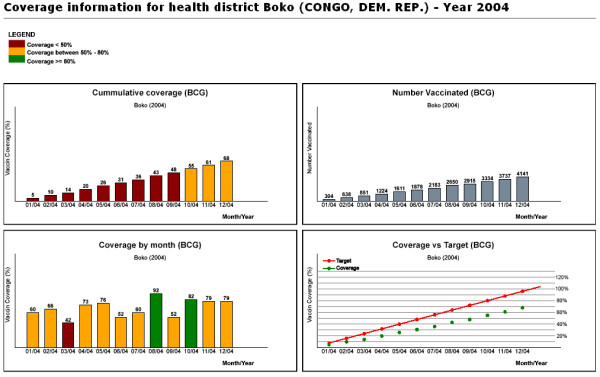
We used SVG to develop a database driven web-based GIS applied to EPI data from three countries of WHO AFRO (World Health Organization – African Region). The system generates interactive district-level country immunization coverage maps and graphs. The approach we describe can be expanded to cover other public health GIS demanding activities, including the design of disease atlases in a resources-constrained environment.
Conclusion
Our system contributes to accumulating evidence demonstrating the potential of SVG technology to develop web-based public health GIS in resources-constrained settings.
-
Subjects:
-
Source:Int J Health Geogr. 2006; 5:24.
-
Document Type:
-
Volume:5
-
Collection(s):
-
Main Document Checksum:urn:sha-512:f0208f9edf0c2b7fcf0ff5afe24d15dd3eabc5a1678f665f205da18ada02e7924179891835e01a7c634860dfe9880ba056657305c5db40495e7cabc55ace12e3
-
Download URL:
-
File Type:
 [PDF
- 642.50 KB
]
[PDF
- 642.50 KB
]
Supporting Files

ON THIS PAGE

CDC STACKS serves as an archival repository of CDC-published products including
scientific findings,
journal articles, guidelines, recommendations, or other public health information authored or
co-authored by CDC or funded partners.
As a repository, CDC STACKS retains documents in their original published format to ensure public access to scientific information.
As a repository, CDC STACKS retains documents in their original published format to ensure public access to scientific information.
You May Also Like
COLLECTION
CDC Public Access