CDC STACKS serves as an archival repository of CDC-published products including scientific findings, journal articles, guidelines, recommendations, or other public health information authored or co-authored by CDC or funded partners.
As a repository, CDC STACKS retains documents in their original published format to ensure public access to scientific information.
i
Summertime Acute Heat Illness in U.S. Emergency Departments from 2006 through 2010: Analysis of a Nationally Representative Sample
-
Jun 17 2014
-
Source: Environ Health Perspect. 122(11):1209-1215.
Details:
-
Alternative Title:Environ Health Perspect
-
Personal Author:
-
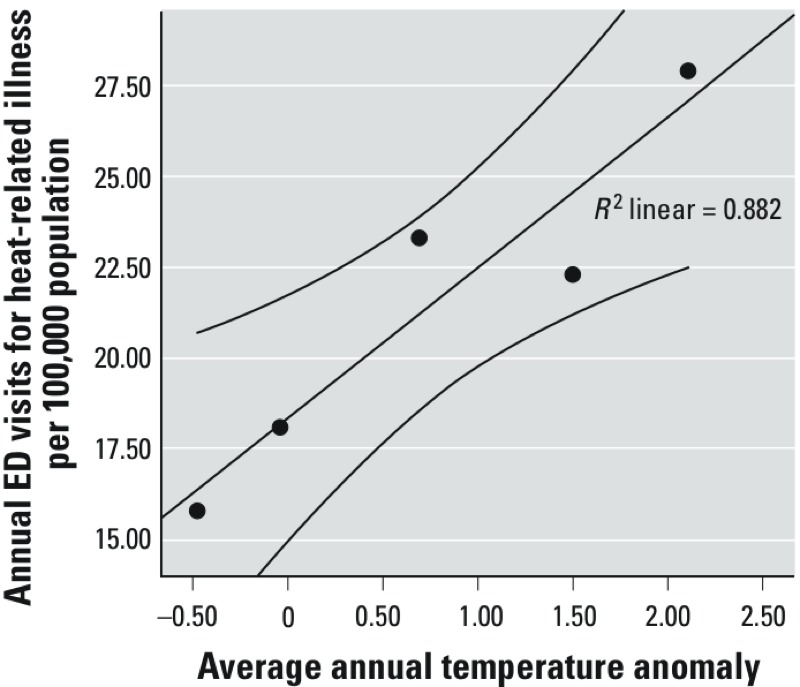
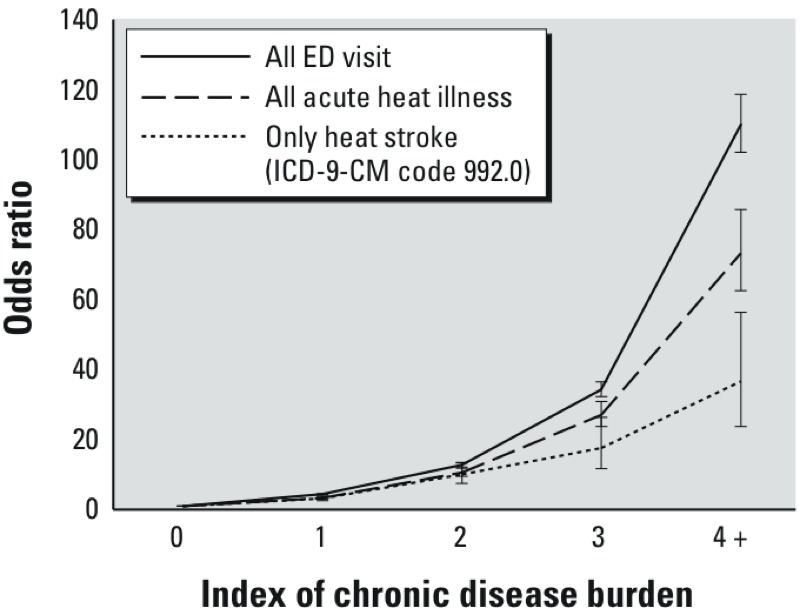
Description:Patients with acute heat illness present primarily to emergency departments (EDs), yet little is known regarding these visits.|We aimed to describe acute heat illness visits to U.S. EDs from 2006 through 2010 and identify factors associated with hospital admission or with death in the ED.|We extracted ED case-level data from the Nationwide Emergency Department Sample (NEDS) for 2006-2010, defining cases as ED visits from May through September with any heat illness diagnosis (ICD-9-CM 992.0-992.9). We correlated visit rates and temperature anomalies, analyzed demographics and ED disposition, identified risk factors for adverse outcomes, and examined ED case fatality rates (CFR).|There were 326,497 (95% CI: 308,372, 344,658) cases, with 287,875 (88.2%) treated and released, 38,392 (11.8%) admitted, and 230 (0.07%) died in the ED. Heat illness diagnoses were first-listed in 68%. 74.7% had heat exhaustion, 5.4% heat stroke. Visit rates were highly correlated with annual temperature anomalies (Pearson correlation coefficient 0.882, p = 0.005). Treat-and-release rates were highest for younger adults (26.2/100,000/year), whereas hospitalization and death-in-the-ED rates were highest for older adults (6.7 and 0.03/100,000/year, respectively); all rates were highest in rural areas. Heat stroke had an ED CFR of 99.4/10,000 (95% CI: 78.7, 120.1) visits and was diagnosed in 77.0% of deaths. Adjusted odds of hospital admission or death in the ED were higher among elders, males, urban and low-income residents, and those with chronic conditions.|Heat illness presented to the ED frequently, with highest rates in rural areas. Case definitions should include all diagnoses. Visit rates were correlated with temperature anomalies. Heat stroke had a high ED CFR. Males, elders, and the chronically ill were at greatest risk of admission or death in the ED. Chronic disease burden exponentially increased this risk.
-
Subjects:
-
Source:
-
Document Type:
-
Volume:122
-
Issue:11
-
Collection(s):
-
Main Document Checksum:
-
Download URL:
-
File Type:
 [PDF-303.94 KB]


