Temporal Trends in Fast-Food Restaurant Energy, Sodium, Saturated Fat, and Trans Fat Content, United States, 1996–2013
Supporting Files
Public Domain

-
Dec 31 2014
-
File Language:
English
Details
-
Journal Article:Preventing Chronic Disease (PCD)
-
Personal Author:
-
Description:Introduction
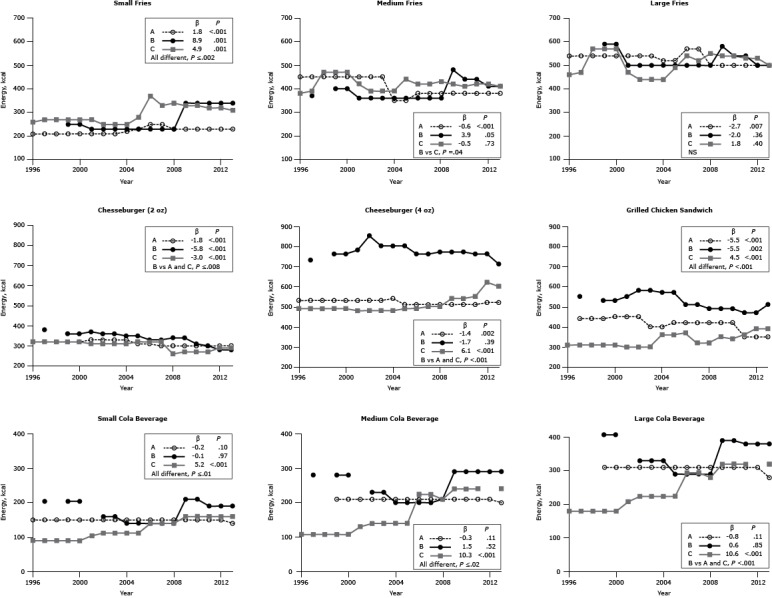
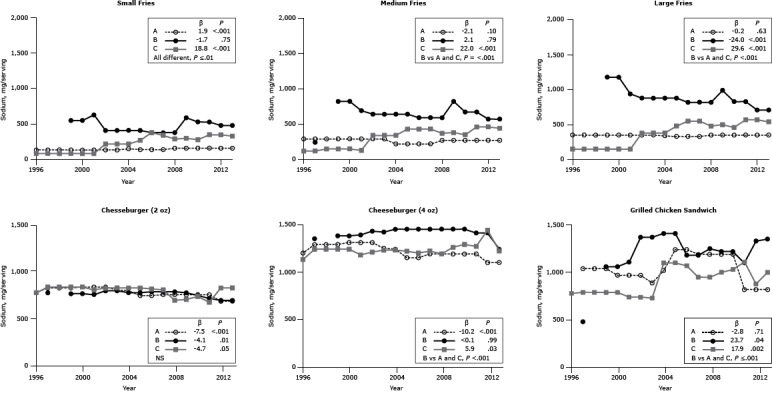
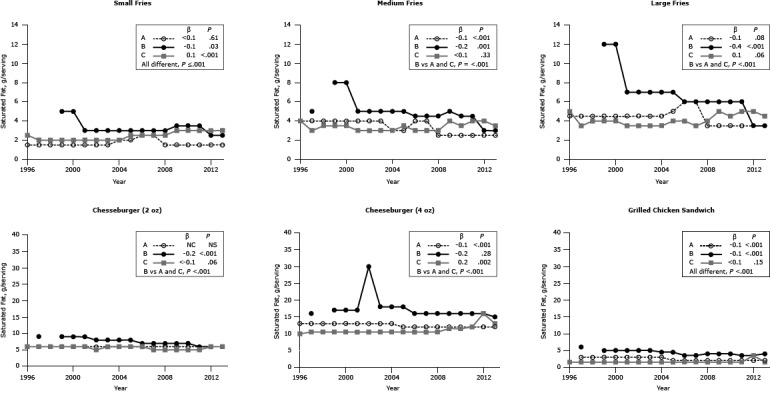
Excess intakes of energy, sodium, saturated fat, and trans fat are associated with increased risk for cardiometabolic syndrome. Trends in fast-food restaurant portion sizes can inform policy decisions. We examined the variability of popular food items in 3 fast-food restaurants in the United States by portion size during the past 18 years.
Methods
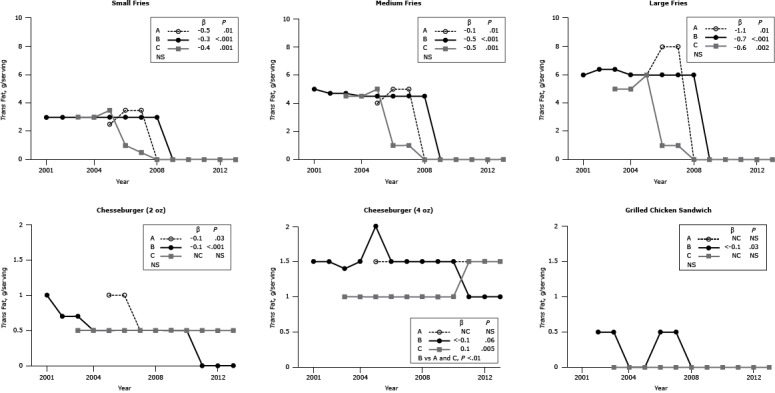
Items from 3 national fast-food chains were selected: French fries, cheeseburgers, grilled chicken sandwich, and regular cola. Data on energy, sodium, saturated fat, and trans fat content were collated from 1996 through 2013 using an archival website. Time trends were assessed using simple linear regression models, using energy or a nutrient component as the dependent variable and the year as the independent variable.
Results
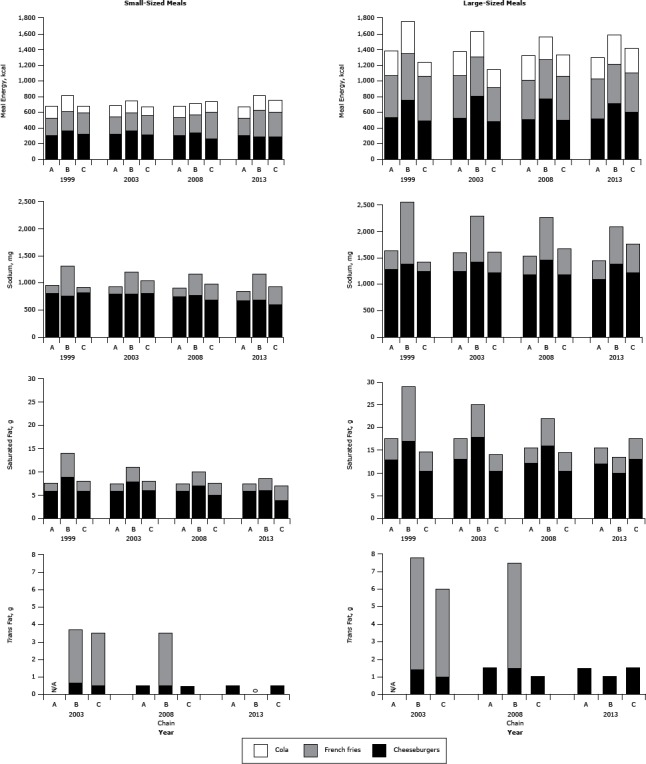
For most items, energy content per serving differed among chain restaurants for all menu items (P ≤ .04); energy content of 56% of items decreased (β range, −0.1 to −5.8 kcal) and the content of 44% increased (β range, 0.6–10.6 kcal). For sodium, the content of 18% of the items significantly decreased (β range, −4.1 to −24.0 mg) and the content for 33% increased (β range, 1.9–29.6 mg). Absolute differences were modest. The saturated and trans fat content, post-2009, was modest for French fries. In 2013, the energy content of a large-sized bundled meal (cheeseburger, French fries, and regular cola) represented 65% to 80% of a 2,000-calorie-per-day diet, and sodium content represented 63% to 91% of the 2,300-mg-per-day recommendation and 97% to 139% of the 1,500-mg-per-day recommendation.
Conclusion
Findings suggest that efforts to promote reductions in energy, sodium, saturated fat, and trans fat intakes need to be shifted from emphasizing portion-size labels to additional factors such as total calories, frequency of eating, number of items ordered, menu choices, and energy-containing beverages.
-
Subjects:
-
Source:Prev Chronic Dis. 11.
-
DOI:
-
ISSN:1545-1151
-
Document Type:
-
Place as Subject:
-
Volume:11
-
Collection(s):
-
Main Document Checksum:urn:sha-512:985a1c25fe3b2157c152932458c065fafb0b8baba0eefe2c8e20ab0be19156d3e1f666153295112039156bda5ef74b7033fe31fe31a05b83562face354aaeddc
-
Download URL:
-
File Type:
 [PDF
- 409.68 KB
]
[PDF
- 409.68 KB
]
Supporting Files

File Language:
English
ON THIS PAGE

CDC STACKS serves as an archival repository of CDC-published products including
scientific findings,
journal articles, guidelines, recommendations, or other public health information authored or
co-authored by CDC or funded partners.
As a repository, CDC STACKS retains documents in their original published format to ensure public access to scientific information.
As a repository, CDC STACKS retains documents in their original published format to ensure public access to scientific information.
You May Also Like
COLLECTION
Preventing Chronic Disease