Sodium, Saturated Fat, and Trans Fat Content Per 1,000 Kilocalories: Temporal Trends in Fast-Food Restaurants, United States, 2000–2013
Supporting Files
Public Domain

-
Dec 31 2014
-
File Language:
English
Details
-
Journal Article:Preventing Chronic Disease (PCD)
-
Personal Author:
-
Description:Introduction
Intakes of sodium, saturated fat, and trans fat remain high despite recommendations to limit these nutrients for cardiometabolic risk reduction. A major contributor to intake of these nutrients is foods prepared outside the home, particularly from fast-food restaurants.
Methods
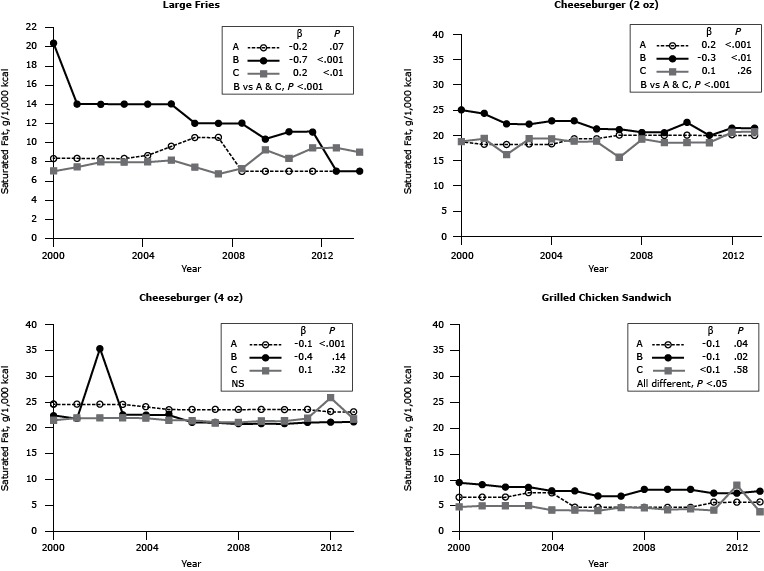
We analyzed the nutrient content of frequently ordered items from 3 US national fast-food chains: fried potatoes (large French fries), cheeseburgers (2-oz and 4-oz), and a grilled chicken sandwich. We used an archival website to obtain data on sodium, saturated fat, and trans fat content for these items from 2000 through 2013. The amount of each nutrient per 1,000 kcal was calculated to determine whether there were trends in product reformulation.
Results
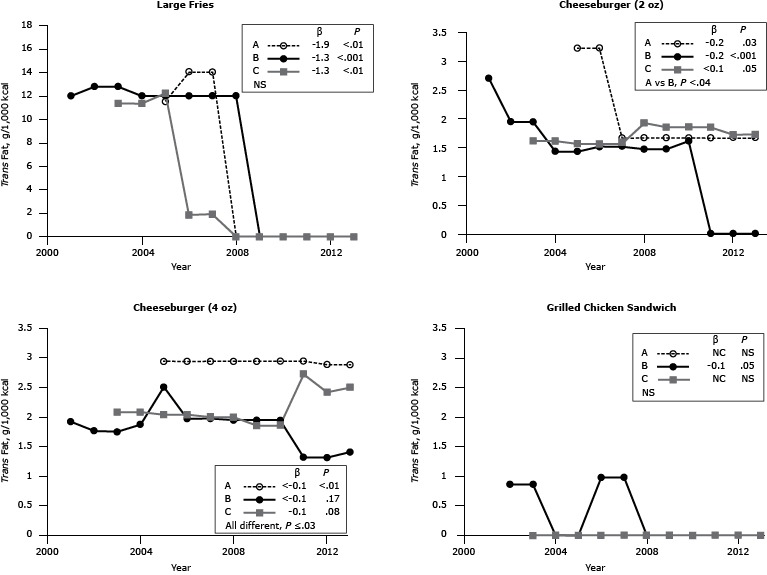
Sodium content per 1,000 kcal differed widely among the 3 chains by food item, precluding generalizations across chains. During the 14-year period, sodium content per 1,000 kcal for large French fries remained high for all 3 chains, although the range narrowed from 316–2,000 mg per 1,000 kcal in 2000 to 700–1,420 mg per 1,000 kcal in 2013. Among the items assessed, cheeseburgers were the main contributor of saturated fat, and there was little change in content per 1,000 kcal for this item during the 14-year period. In contrast, there was a sharp decline in saturated and trans fat content of large French fries per 1,000 kcal. Post-2009, the major contributor of trans fat per 1,000 kcal was cheeseburgers; trans fat content of this item remained stable during the 14-year period.
Conclusion
With the exception of French fries, little evidence was found during the 14-year period of product reformulation by restaurants to become more consistent with dietary guidance to reduce intakes of sodium and saturated fat.
-
Subjects:
-
Source:Prev Chronic Dis. 11.
-
DOI:
-
ISSN:1545-1151
-
Document Type:
-
Place as Subject:
-
Volume:11
-
Collection(s):
-
Main Document Checksum:urn:sha-512:25227990d4e7a413997f7e7f737500404efff66cb05fdc59b0413e4d995577f046d4006bb1bfb9529180ea377b0c7ce0298f76ab2964edfb65eed66af5bfb246
-
Download URL:
-
File Type:
 [PDF
- 286.26 KB
]
[PDF
- 286.26 KB
]
Supporting Files

File Language:
English
ON THIS PAGE

CDC STACKS serves as an archival repository of CDC-published products including
scientific findings,
journal articles, guidelines, recommendations, or other public health information authored or
co-authored by CDC or funded partners.
As a repository, CDC STACKS retains documents in their original published format to ensure public access to scientific information.
As a repository, CDC STACKS retains documents in their original published format to ensure public access to scientific information.
You May Also Like
COLLECTION
Preventing Chronic Disease