Physical Activity–Friendly Policies and Community Design Features in the US, 2014 and 2021
Supporting Files
Public Domain

-
8 17 2023
-
File Language:
English
Details
-
Journal Article:Preventing Chronic Disease (PCD)
-
Personal Author:
-
Description:Introduction
The 2014 Community-Based Survey of Supports for Healthy Eating and Active Living documented the prevalence of US municipal policy and community design supports for physical activity. The survey was repeated in 2021. Our study examined change in the prevalence of supports from 2014 to 2021, overall and by municipality characteristic.
Methods
Municipalities were sampled independently each survey year. We calculated prevalence in 2014 and 2021 and the prevalence ratio (PR) for 15 supports covering zoning codes, park policies and budgets, design standards, Complete Streets policies, and shared use agreements. We used a Bonferroni-corrected Breslow-Day test to test for interaction by municipality characteristic.
Results
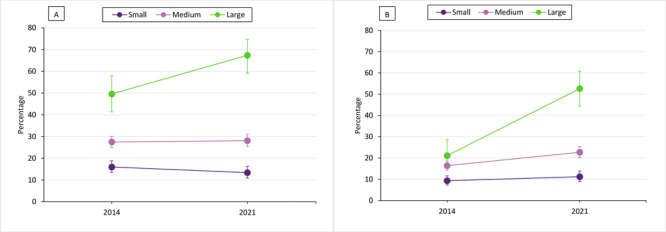
In 2014 (2,009 municipalities) compared with 2021 (1,882 municipalities), prevalence increased for several zoning codes: block sizes of walkable distances (PR = 1.46), minimum sidewalk width (PR = 1.19), pedestrian amenities along streets (PR = 1.15), continuous sidewalk coverage (PR = 1.14), and building orientation to pedestrian scale (PR = 1.08). Prevalence also increased for design standards requiring dedicated bicycle infrastructure for roadway expansion projects or street retrofits (PR = 1.19). Prevalence declined for shared use agreements (PR = 0.87). The prevalence gap widened between the most and least populous municipalities for Complete Streets policies (from a gap of 33.6 percentage points [PP] in 2014 to 54.0 PP in 2021) and for zoning codes requiring block sizes that were walkable distances (from 11.8 PP to 41.4 PP).
Conclusion
To continue progress, more communities could consider adopting physical activity–friendly policies and design features.
-
Subjects:
-
Source:Prev Chronic Dis. 2023; 20
-
DOI:
-
ISSN:1545-1151
-
Pubmed ID:37590901
-
Pubmed Central ID:PMC10457105
-
Document Type:
-
Volume:20
-
Collection(s):
-
Main Document Checksum:urn:sha-512:1720296b53620521a3b02fd10aebd368a0c5f3c804d2780e1277a1fe684d2baf08fb08dee9a37485fe52ec2da2a4cca41c0e99e0c2c6d8cb29824ebe6b64090d
-
Download URL:
-
File Type:
 [PDF
- 505.80 KB
]
[PDF
- 505.80 KB
]
Supporting Files

File Language:
English
ON THIS PAGE

CDC STACKS serves as an archival repository of CDC-published products including
scientific findings,
journal articles, guidelines, recommendations, or other public health information authored or
co-authored by CDC or funded partners.
As a repository, CDC STACKS retains documents in their original published format to ensure public access to scientific information.
As a repository, CDC STACKS retains documents in their original published format to ensure public access to scientific information.
You May Also Like
COLLECTION
Preventing Chronic Disease