Population RBC folate concentrations can be accurately estimated from measured whole blood folate, measured hemoglobin, and predicted serum folate—cross-sectional data from the NHANES 1988–2010
Supporting Files

-
3 01 2020
-
File Language:
English
Details
-
Alternative Title:Am J Clin Nutr
-
Personal Author:
-
Description:Background:
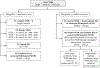
RBC folate (RBF) is an indicator of folate status and risk of neural-tube defects. It is calculated from whole blood folate (WBF), serum folate (SFOL), and hematocrit (Hct). SFOL and/or Hct are sometimes unavailable; hemoglobin (Hb) is generally available in surveys.
Objectives:
We assessed the ability of different RBF approximations to generate population data in women aged 12–49 y.
Methods:
Using SFOL, RBF, Hct, Hb, and mean corpuscular Hb content (MCHC) from prefortification (1988–1994) and postfortification (1999–2006, 2007–2010) NHANES we applied 6 approaches: #1) assume SFOL = 0; #2) impute SFOL (population median); #3) impute Hct (population median); #4) estimate Hct (Hb/MCHC); #5) assume SFOL = 0 and estimate Hct; and #6) predict SFOL (from WBF) and estimate Hct. For each approach, we calculated the paired percentage difference to the “true” RBF and estimated various statistics.
Results:
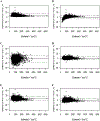
For 2007–2010 (unweighted data), the median relative difference from “true” RBF was lowest for approaches #2 (−0.74%), #4 (−0.96%), and #6 (−1.15%), intermediate for #3 (−3.36%), and highest for #5 (4.96%) and #1 (5.78%). The 95% agreement limits were smallest for approach #1 (2.33%, 13.0%) and largest for #3 (−20.8%, 11.3%). Approach #2 showed concentration-dependence (negative compared with positive differences at low compared with high RBF). Using weighted data, we found similar patterns across approaches for mean relative differences by demographic subgroup for all 3 time periods.
Conclusions:
We obtained the best agreement between estimated and “true” RBF when we predicted SFOL using a regression equation obtained from a subset of samples (approach #6). Alternatively, the consistent overestimation of RBF when assuming SFOL = 0 (~6%) could be addressed by adjusting the data (approach #5). Similar observations for pre- and postfortification periods suggest applicability to low and high folate status situations, but should be confirmed elsewhere. To estimate RBF, at least WBF and Hb are needed. Am J Clin Nutr 2020;111:601–612.
-
Subjects:
-
Source:Am J Clin Nutr. 111(3):601-612
-
Pubmed ID:31858145
-
Pubmed Central ID:PMC10059072
-
Document Type:
-
Funding:
-
Name as Subject:
-
Place as Subject:
-
Volume:111
-
Issue:3
-
Collection(s):
-
Main Document Checksum:urn:sha256:a4f95e0d05911ed012dd1b14999f60690fc8b9feed82ad7c51297e2692d7d342
-
Download URL:
-
File Type:
 [PDF
- 633.98 KB
]
[PDF
- 633.98 KB
]
Supporting Files

File Language:
English
ON THIS PAGE

CDC STACKS serves as an archival repository of CDC-published products including
scientific findings,
journal articles, guidelines, recommendations, or other public health information authored or
co-authored by CDC or funded partners.
As a repository, CDC STACKS retains documents in their original published format to ensure public access to scientific information.
As a repository, CDC STACKS retains documents in their original published format to ensure public access to scientific information.
You May Also Like
COLLECTION
CDC Public Access