WISQARS Cost of Injury for public health research and practice
Supporting Files

-
4 2023
-
File Language:
English
Details
-
Alternative Title:Inj Prev
-
Personal Author:
-
Description:Aim
Since 2011 the Centers for Disease Control and Prevention’s Web-based Injury Statistics Query and Reporting System (WISQARS) has demonstrated per-injury average and population total medical and non-medical costs of injuries by type (such as unintentional cut/pierce) in the USA. This article describes the impact of data and methods changes in the newest version of WISQARS Cost of Injury.
Methods
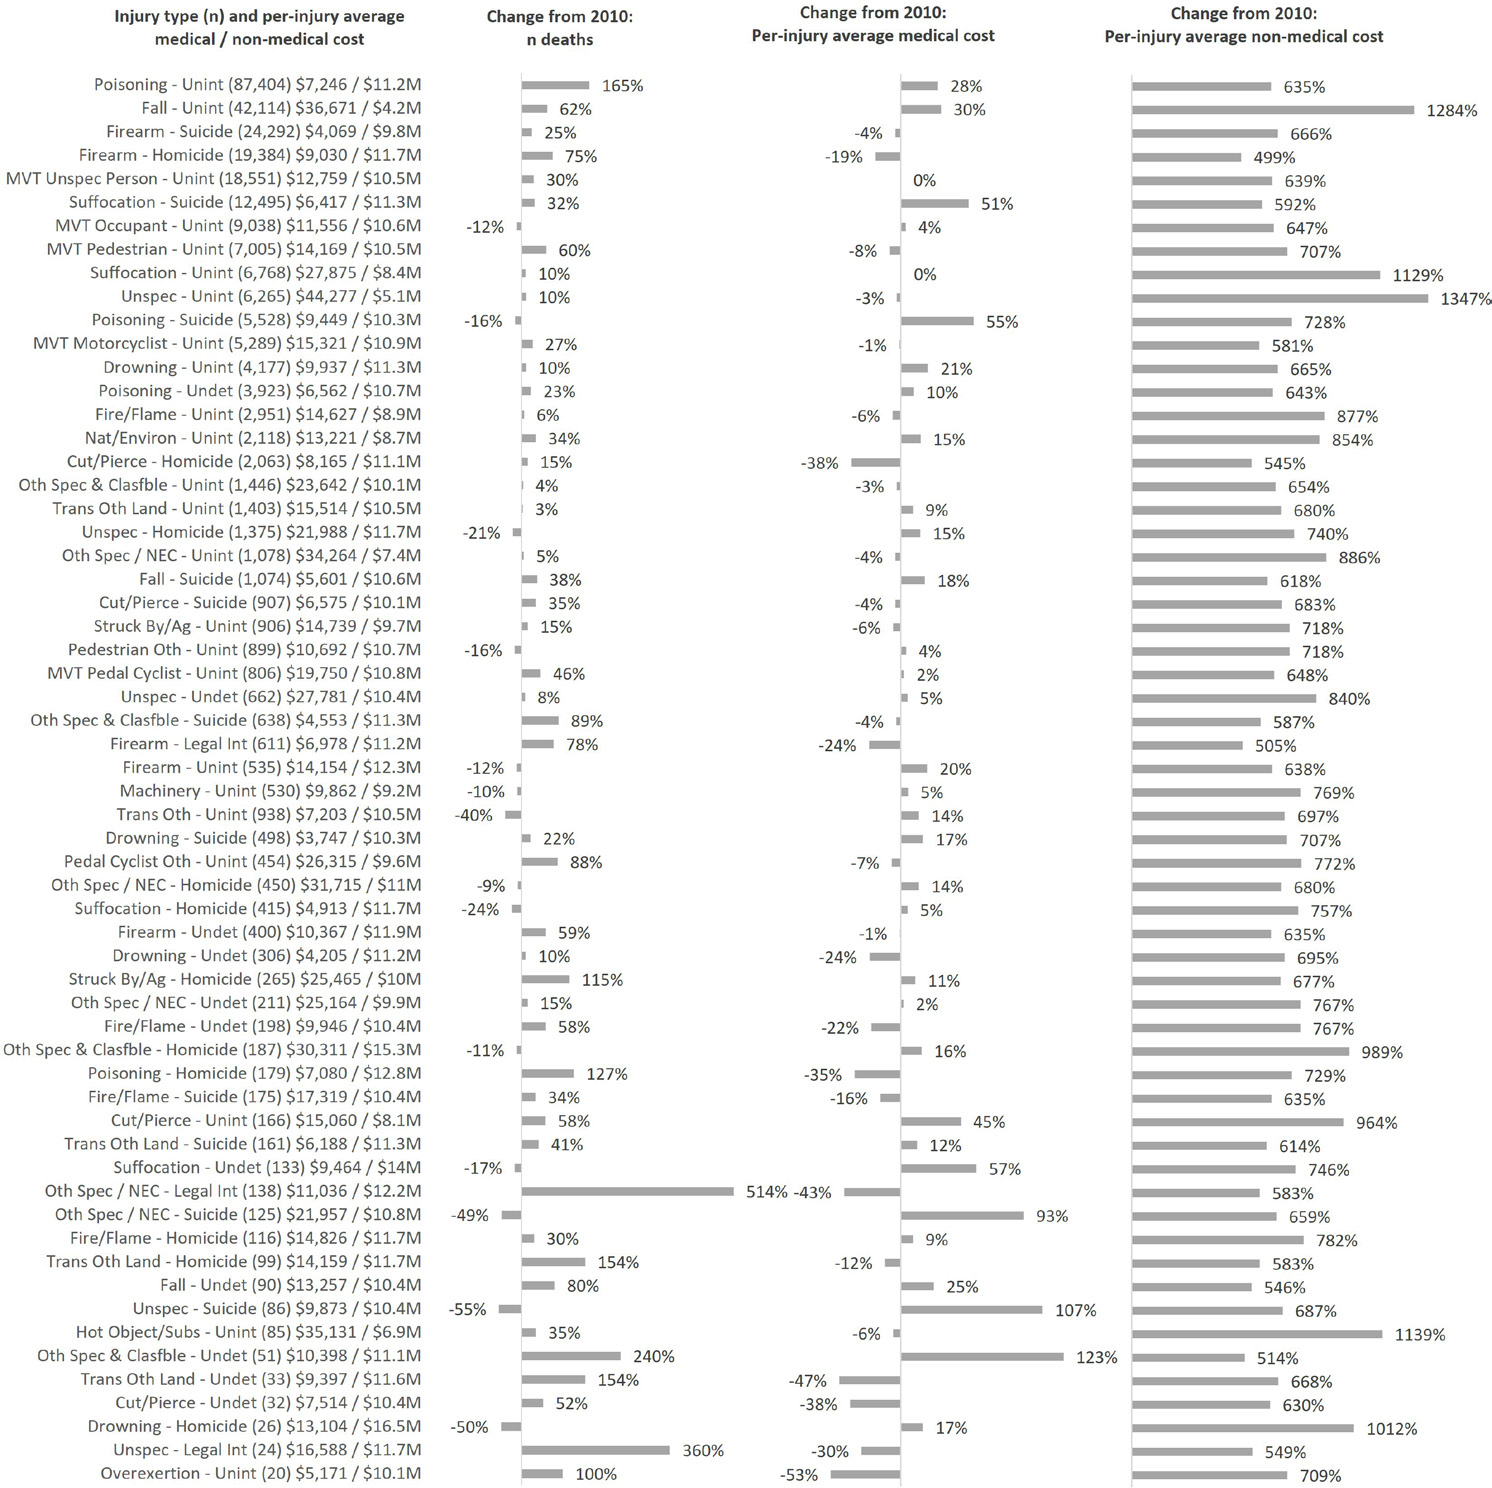
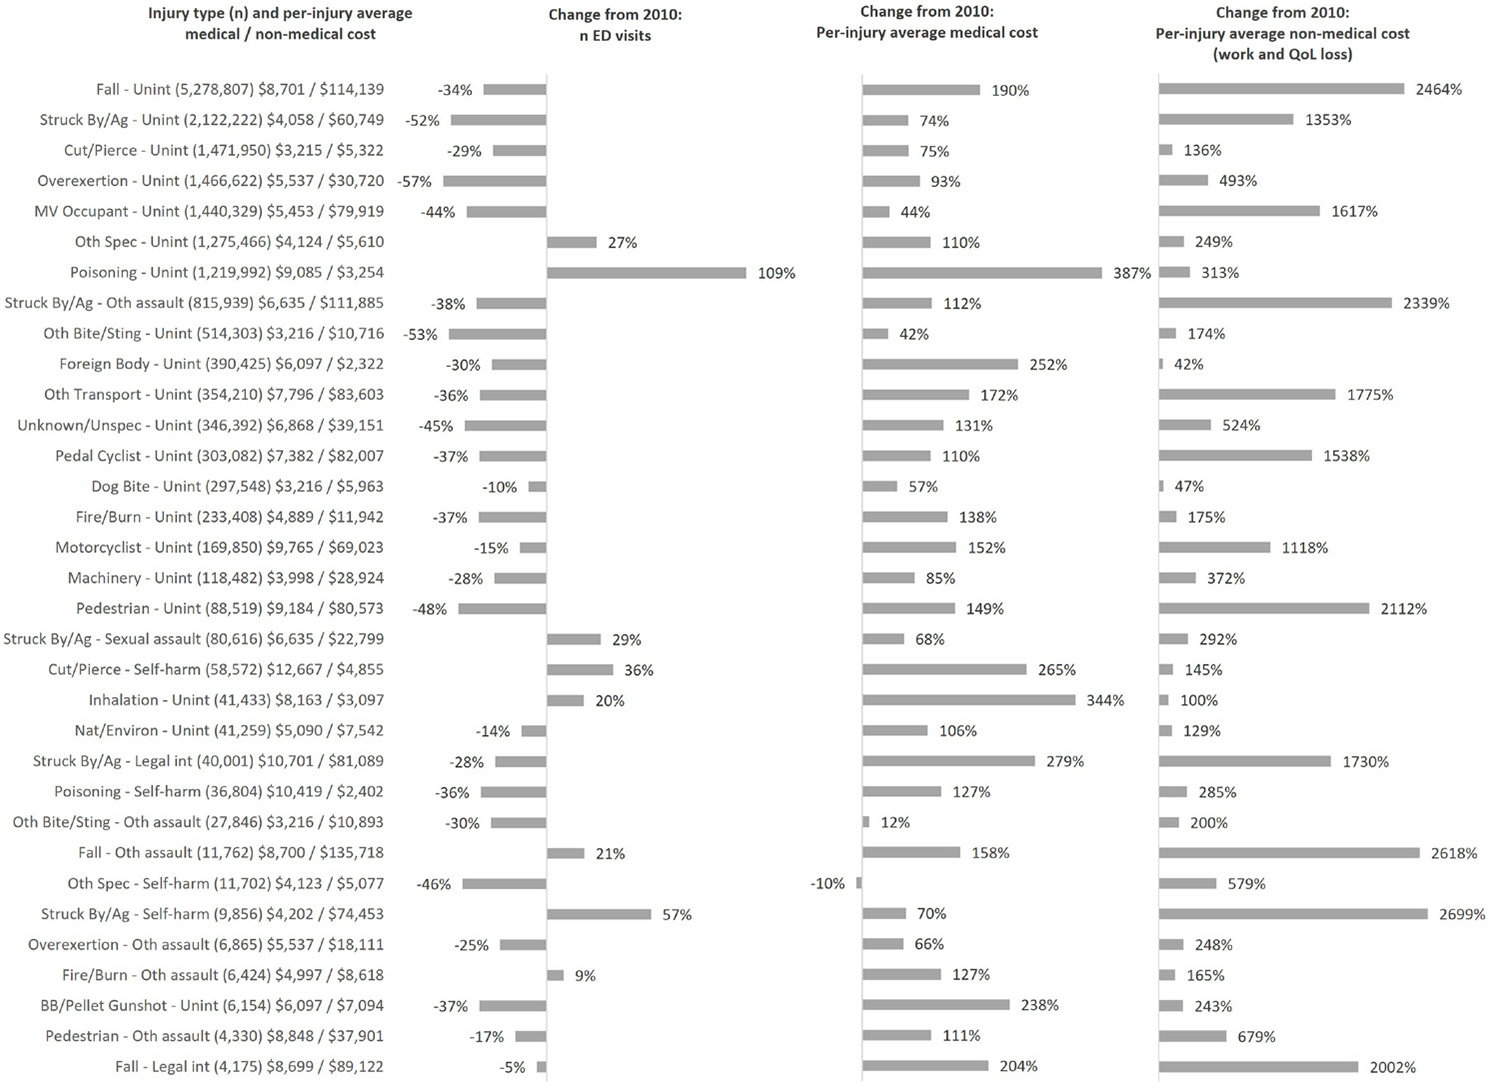
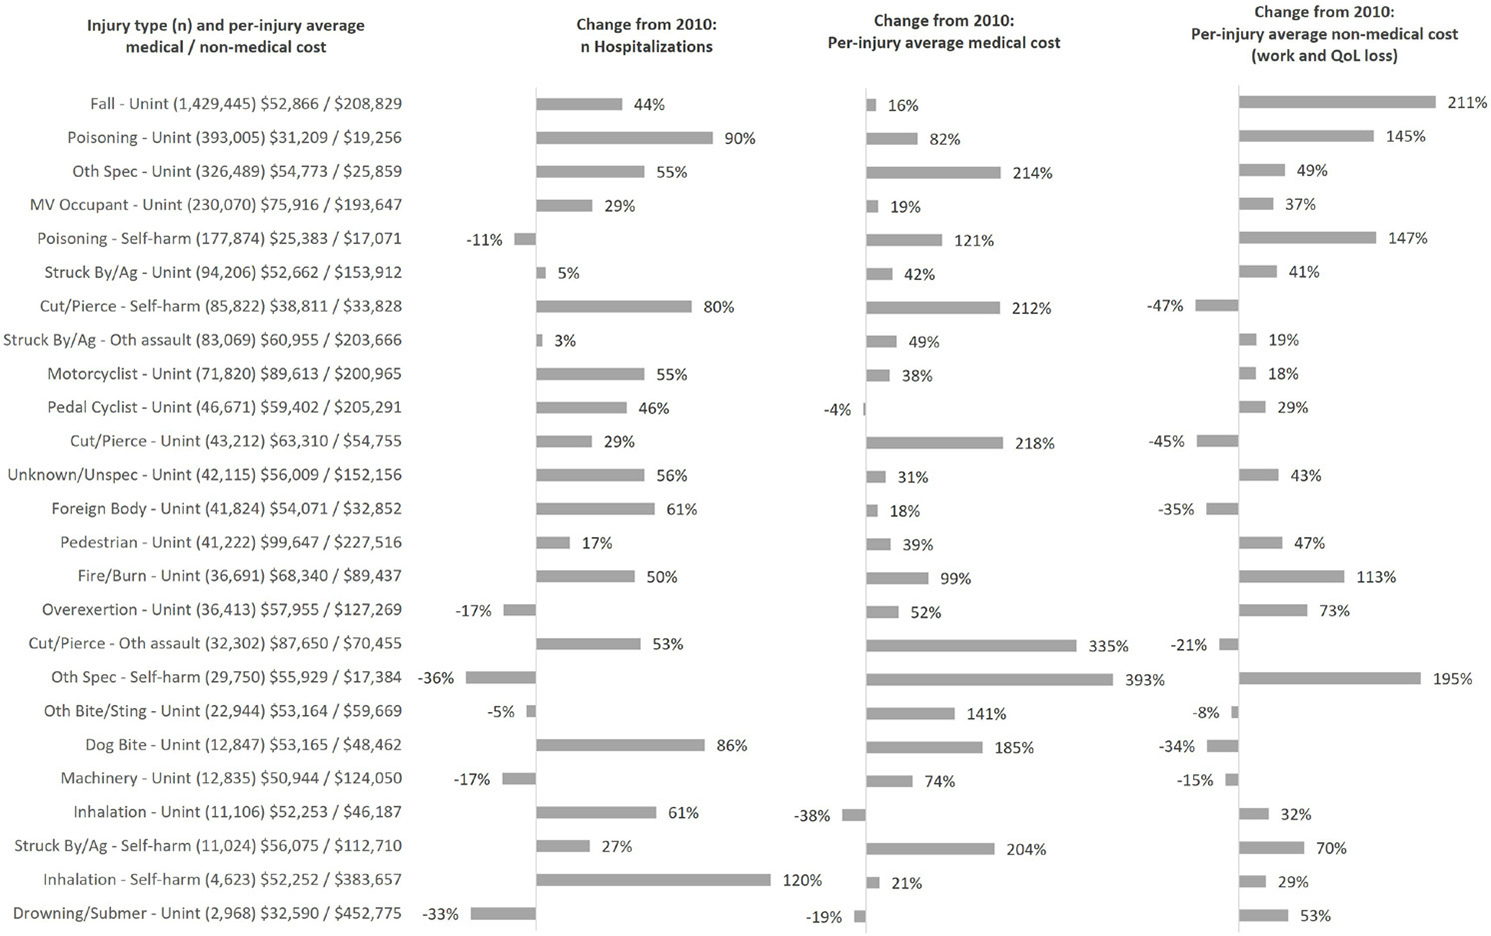
Data sources and methods were compared for the legacy version of the WISQARS Cost of Injury website (available 2011–2021; most recent prior update was published in 2014 with 2010 injury incidence and costs) and the new version (published 2021; 2015-present injury incidence and costs). Cost data sources were updated for the new website and the basis for medical costs and non-fatal injury work loss costs changed from mathematical modelling (combined estimates from multiple data sources) in the legacy website to statistical modelling of actual injury-related medical and work loss financial transactions in the new website. Monetary valuation of non-medical costs for injury deaths changed from lost employment income and household work in the legacy website to value of statistical life. Quality of life loss costs were added for non-fatal injuries. Per-injury average medical and non-medical costs by injury type (mechanism and intent) and total population injury costs were compared for years 2010 (legacy website data) and 2020 (new website data) to illustrate the impact of data and methods changes on reported costs in the context of changed annual injury incidence.
Results
Owing to more comprehensive cost capture yielding higher per-injury average costs for most injury types—including those with high incidence in 2020 such as unintentional poisoning and unintentional falls—reported total US medical and non-medical injury costs were substantially higher in 2020 (US$4.6 trillion) compared with 2010 (US$693 billion) (both 2020 USD).
Conclusions and relevance
New data and methods increased the injury costs reported in WISQARS Cost of Injury. Researchers and public health professionals can use this information to proficiently communicate the burden of injuries and violence in terms of economic cost.
-
Subjects:
-
Source:Inj Prev. 29(2):150-157
-
Pubmed ID:36396442
-
Pubmed Central ID:PMC10033347
-
Document Type:
-
Funding:
-
Name as Subject:
-
Place as Subject:
-
Volume:29
-
Issue:2
-
Collection(s):
-
Main Document Checksum:urn:sha256:a8c4877c8136898761e9c0af5f6d36256c5d7c959df7686839665950e768b3ef
-
Download URL:
-
File Type:
 [PDF
- 873.67 KB
]
[PDF
- 873.67 KB
]
Supporting Files

File Language:
English
ON THIS PAGE

CDC STACKS serves as an archival repository of CDC-published products including
scientific findings,
journal articles, guidelines, recommendations, or other public health information authored or
co-authored by CDC or funded partners.
As a repository, CDC STACKS retains documents in their original published format to ensure public access to scientific information.
As a repository, CDC STACKS retains documents in their original published format to ensure public access to scientific information.
You May Also Like
COLLECTION
CDC Public Access