Trends in Cardiovascular Health Metrics and Associations With All-Cause and CVD Mortality Among US Adults
Supporting Files

-
3 28 2012
-
File Language:
English
Details
-
Alternative Title:JAMA
-
Personal Author:
-
Description:Context
Recent recommendations from the American Heart Association aim to improve cardiovascular health by encouraging the general population to meet 7 cardiovascular health metrics: not smoking; being physically active; having normal blood pressure, blood glucose and total cholesterol levels, and weight; and eating a healthy diet.
Objective
To examine time trends in cardiovascular health metrics and to estimate joint associations and population-attributable fractions of these metrics in relation to all-cause and cardiovascular disease (CVD) mortality risk.
Design, Setting, and Participants
Study of a nationally representative sample of 44 959 US adults (≥20 years), using data from the National Health and Nutrition Examination Survey (NHANES) 1988–1994, 1999–2004, and 2005–2010 and the NHANES III Linked Mortality File (through 2006).
Main Outcome Measures
All-cause, CVD, and ischemic heart disease (IHD) mortality.
Results
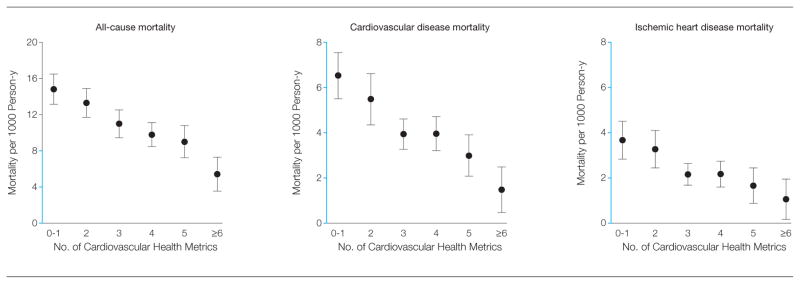
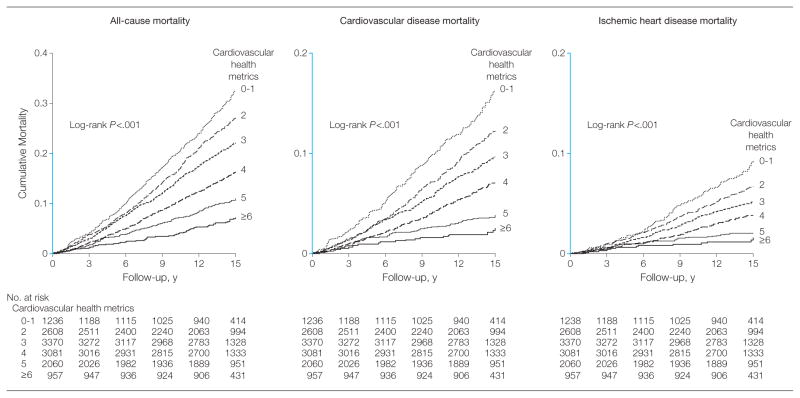
Few participants met all 7 cardiovascular health metrics (2.0% [95% CI, 1.5%–2.5%] in 1988–1994, 1.2% [95% CI, 0.8%–1.9%] in 2005–2010). Among NHANES III participants, 2673 all-cause, 1085 CVD, and 576 IHD deaths occurred (median follow-up, 14.5 years). Among participants who met 1 or fewer cardiovascular health metrics, age- and sex-standardized absolute risks were 14.8 (95% CI, 13.2–16.5) deaths per 1000 person-years for all-cause mortality, 6.5 (95% CI, 5.5–7.6) for CVD mortality, and 3.7 (95% CI, 2.8–4.5) for IHD mortality. Among those who met 6 or more metrics, corresponding risks were 5.4 (95% CI, 3.6–7.3) for all-cause mortality, 1.5 (95% CI, 0.5–2.5) for CVD mortality, and 1.1 (95% CI, 0.7–2.0) for IHD mortality. Adjusted hazard ratios were 0.49 (95% CI, 0.33–0.74) for all-cause mortality, 0.24 (95% CI, 0.13–0.47) for CVD mortality, and 0.30 (95% CI, 0.13–0.68) for IHD mortality, comparing participants who met 6 or more vs 1 or fewer cardiovascular health metrics. Adjusted population-attributable fractions were 59% (95% CI, 33%–76%) for all-cause mortality, 64% (95% CI, 28%–84%) for CVD mortality, and 63% (95% CI, 5%–89%) for IHD mortality.
Conclusion
Meeting a greater number of cardiovascular health metrics was associated with a lower risk of total and CVD mortality, but the prevalence of meeting all 7 cardiovascular health metrics was low in the study population.
-
Subjects:
-
Source:JAMA. 307(12):1273-1283
-
Pubmed ID:22427615
-
Pubmed Central ID:PMC9004324
-
Document Type:
-
Funding:
-
Volume:307
-
Issue:12
-
Collection(s):
-
Main Document Checksum:urn:sha256:089b0970acb0133010b2c8a5f34eb308eb77a875c3f4e40724542b1e7ba62b5b
-
Download URL:
-
File Type:
 [PDF
- 337.25 KB
]
[PDF
- 337.25 KB
]
Supporting Files

File Language:
English
ON THIS PAGE

CDC STACKS serves as an archival repository of CDC-published products including
scientific findings,
journal articles, guidelines, recommendations, or other public health information authored or
co-authored by CDC or funded partners.
As a repository, CDC STACKS retains documents in their original published format to ensure public access to scientific information.
As a repository, CDC STACKS retains documents in their original published format to ensure public access to scientific information.
You May Also Like
COLLECTION
CDC Public Access