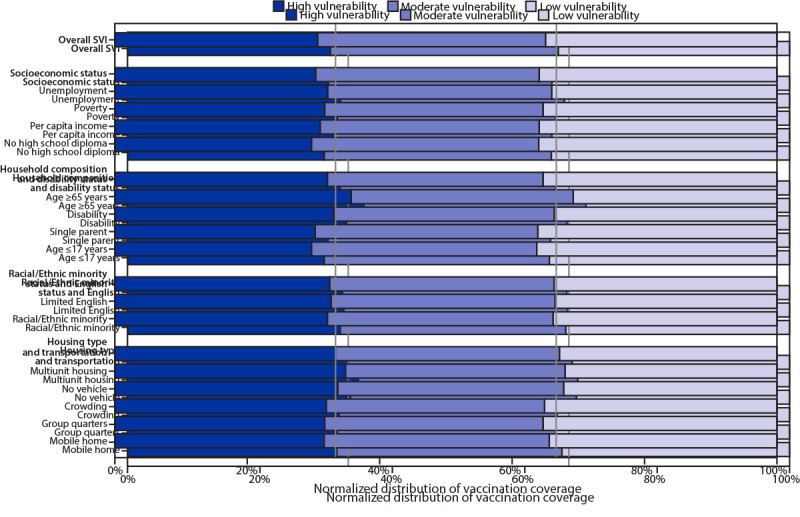
County-Level COVID-19 Vaccination Coverage and Social Vulnerability — United States, December 14, 2020–March 1, 2021
Supporting Files
Public Domain

-
2021/03/26
-
File Language:
English
Details
-
Journal Article:Morbidity and Mortality Weekly Report
-
Personal Author:Deng, Li ; Gibbs-Scharf, Lynn ; Grossman, Marissa K. ; Hallisey, Elaine ; Harris, LaTreace Q. ; Hughes, Michelle M. ; Murthy, Bhavini Patel ; Musial, Trieste ; Pun, Eugene ; Reynolds, Laura E. ; Ritchey, Matthew D. ; Sharpe, J. Danielle ; Stokley, Shannon ; Toblin, Robin L. ; Ussery, Emily N. ; Wang, Alice ; Weller, Daniel L. ; Whiteman, Ari
-
Description:What is already known about this topic? COVID-19 has disproportionally affected racial/ethnic minority groups and persons who are economically and socially disadvantaged. Ensuring equitable COVID-19 vaccine coverage is a national priority. What is added by this report? In the first 2.5 months of the U.S. vaccination program, high social vulnerability counties had lower COVID-19 vaccination coverage than did low social vulnerability counties. Although vaccination coverage estimates by county-level social vulnerability varied widely among states, disparities in vaccination coverage were observed in the majority of states. What are the implications for public health practice? Continued monitoring of vaccination coverage by social vulnerability metrics is critical for developing tailored, local vaccine administration and outreach efforts to reduce COVID-19 vaccination inequities. [Description provided by NIOSH]
-
Subjects:
-
Keywords:
-
Source:MMWR 2021 Mar; 70(12):431-436
-
Series:
-
ISSN:0149-2195
-
Pubmed ID:33764963
-
Pubmed Central ID:PMC7993557
-
Document Type:
-
Genre:
-
Place as Subject:
-
CIO:
-
Division:
-
Topic:
-
Location:
-
Pages in Document:6 pdf pages
-
Contributor:Shefer, Abigail
-
Volume:70
-
Issue:12
-
NIOSHTIC Number:nn:20062264
-
Contact Point Address:Michelle M. Hughes, CDC COVID-19 Response Team, Atlanta, GA
-
Email:nqw7@cdc.gov
-
Federal Fiscal Year:2021
-
NORA Priority Area:
-
Peer Reviewed:False
-
Collection(s):
-
Main Document Checksum:urn:sha-512:f251af3030884124bd15200ff02c8ca64e15a3ccdf5545b69c7e43c9a1473a159b66582dc7206afa0f4767aeab069a9559c486a902f882316a9040f69a3a0b5c
-
Download URL:
-
File Type:
 [PDF
- 161.21 KB
]
[PDF
- 161.21 KB
]
Supporting Files

File Language:
English
ON THIS PAGE

CDC STACKS serves as an archival repository of CDC-published products including
scientific findings,
journal articles, guidelines, recommendations, or other public health information authored or
co-authored by CDC or funded partners.
As a repository, CDC STACKS retains documents in their original published format to ensure public access to scientific information.
As a repository, CDC STACKS retains documents in their original published format to ensure public access to scientific information.
You May Also Like