Nonalcoholic beverage consumption among adults: United States, 2015-2018
Supporting Files
Public Domain

-
09/03/2020
-
-
Series: NCHS Data Briefs
File Language:
English
Details
-
Personal Author:
-
Corporate Authors:
-
Description:Key findings
Data from the National Health and Nutrition Examination Survey
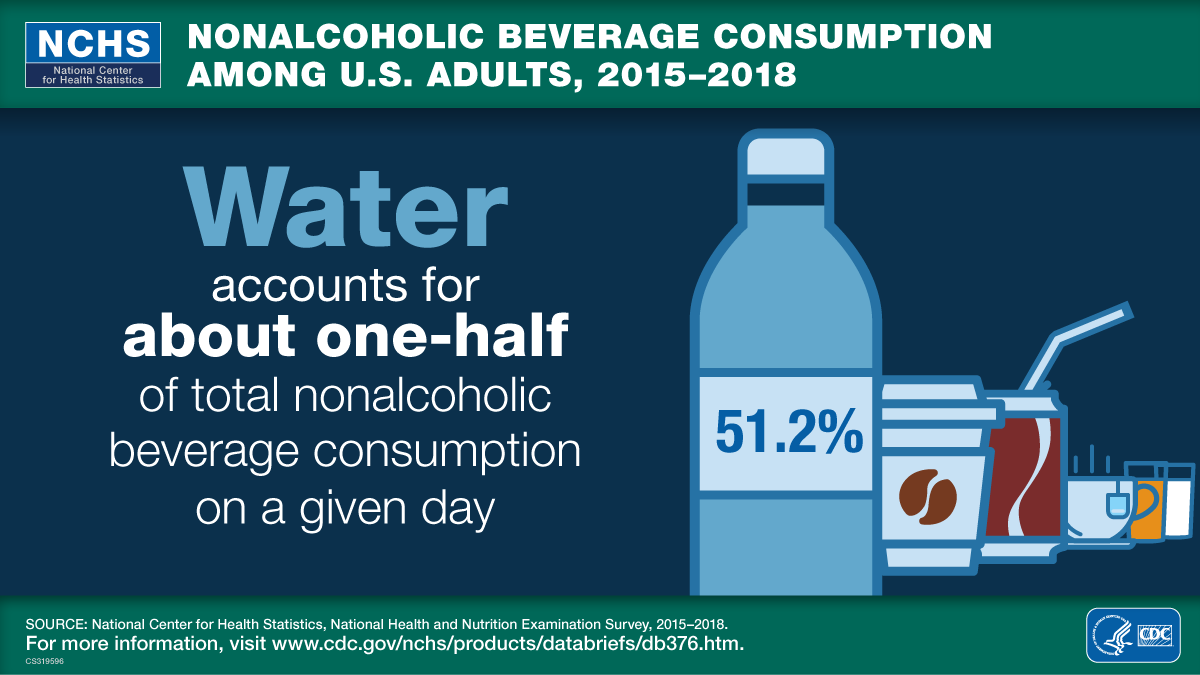
• In 2015-2018, water accounted for more than one-half of total nonalcoholic beverage consumption (51.2%) among U.S. adults.
• Compared with women, men consumed more coffee, sweetened beverages, and fruit beverages as a percentage of total beverage consumption, and less water and tea.
• The contribution of water and sweetened beverages to total beverage consumption decreased with age, while the contribution of coffee, tea, milk, and diet beverages increased with age.
• The contribution of water (60.7%) and tea (13.6%) to total beverage consumption was highest among non-Hispanic Asian adults, while the contribution of coffee (17.3%) was highest among non-Hispanic white adults.
Beverages play a substantial role in meeting total water intake needs and are a major contributor to overall nutrient and caloric intake for the U.S. population (1,2). The 2015-2020 Dietary Guidelines for Americans recommend that water, fat-free and low-fat milk, and 100% juice be the primary beverages consumed (2). This report provides estimates of the contribution of beverage types to total nonalcoholic beverage consumption, by grams, for U.S. adults.
Suggested citation: Martin CB, Wambogo EA, Ahluwalia N, Ogden CL. Nonalcoholic beverage consumption among adults: United States. 2015-2018. NCHS Data Brief, no 376. Hyattsville, MD: National Center for Health Statistics. 2020.
CS319603
db376-h.pdf
-
Subjects:
-
Keywords:
-
Source:National Health and Nutrition Examination Survey
-
Series:
-
Document Type:
-
Genre:
-
Place as Subject:
-
CIO:
-
Topic:
-
Issue:376
-
Collection(s):
-
Main Document Checksum:urn:sha-512:46192d3156a2947c8bcbf7a1567a02c60115c9a32320350e557ed90ba12d370165a6eea2e45c3e9e8e3d58f71e816a29067dda4b87dcfaafa08e1bb47d545f83
-
Download URL:
-
File Type:
 [PDF
- 509.16 KB
]
[PDF
- 509.16 KB
]
Supporting Files

Related Documents
File Language:
English
ON THIS PAGE

CDC STACKS serves as an archival repository of CDC-published products including
scientific findings,
journal articles, guidelines, recommendations, or other public health information authored or
co-authored by CDC or funded partners.
As a repository, CDC STACKS retains documents in their original published format to ensure public access to scientific information.
As a repository, CDC STACKS retains documents in their original published format to ensure public access to scientific information.
You May Also Like
COLLECTION
National Center for Health Statistics