Trends in Number and Distribution of COVID-19 Hotspot Counties — United States, March 8–July 15, 2020
Supporting Files
Public Domain

-
August 21 2020
-
File Language:
English
Details
-
Journal Article:Morbidity and Mortality Weekly Report (MMWR)
-
Personal Author:Oster, Alexandra M. ; Kang, Gloria J. ; Cha, Amy E. ; Beresovsky, Vladislav ; Rose, Charles E. ; Rainisch, Gabriel ; Porter, Laura ; Valverde, Eduardo E. ; Peterson, Elisha B. ; Driscoll, Anne K. ; Norris, Tina ; Wilson, Nana ; Ritchey, Matthew ; Walke, Henry T. ; Rose, Dale A. ; Oussayef, Nadia L. ; Parise, Monica E. ; Moore, Zack S. ; Fleischauer, Aaron T. ; Honein, Margaret A. ; Dirlikov, Emilio ; Villanueva, Julie
-
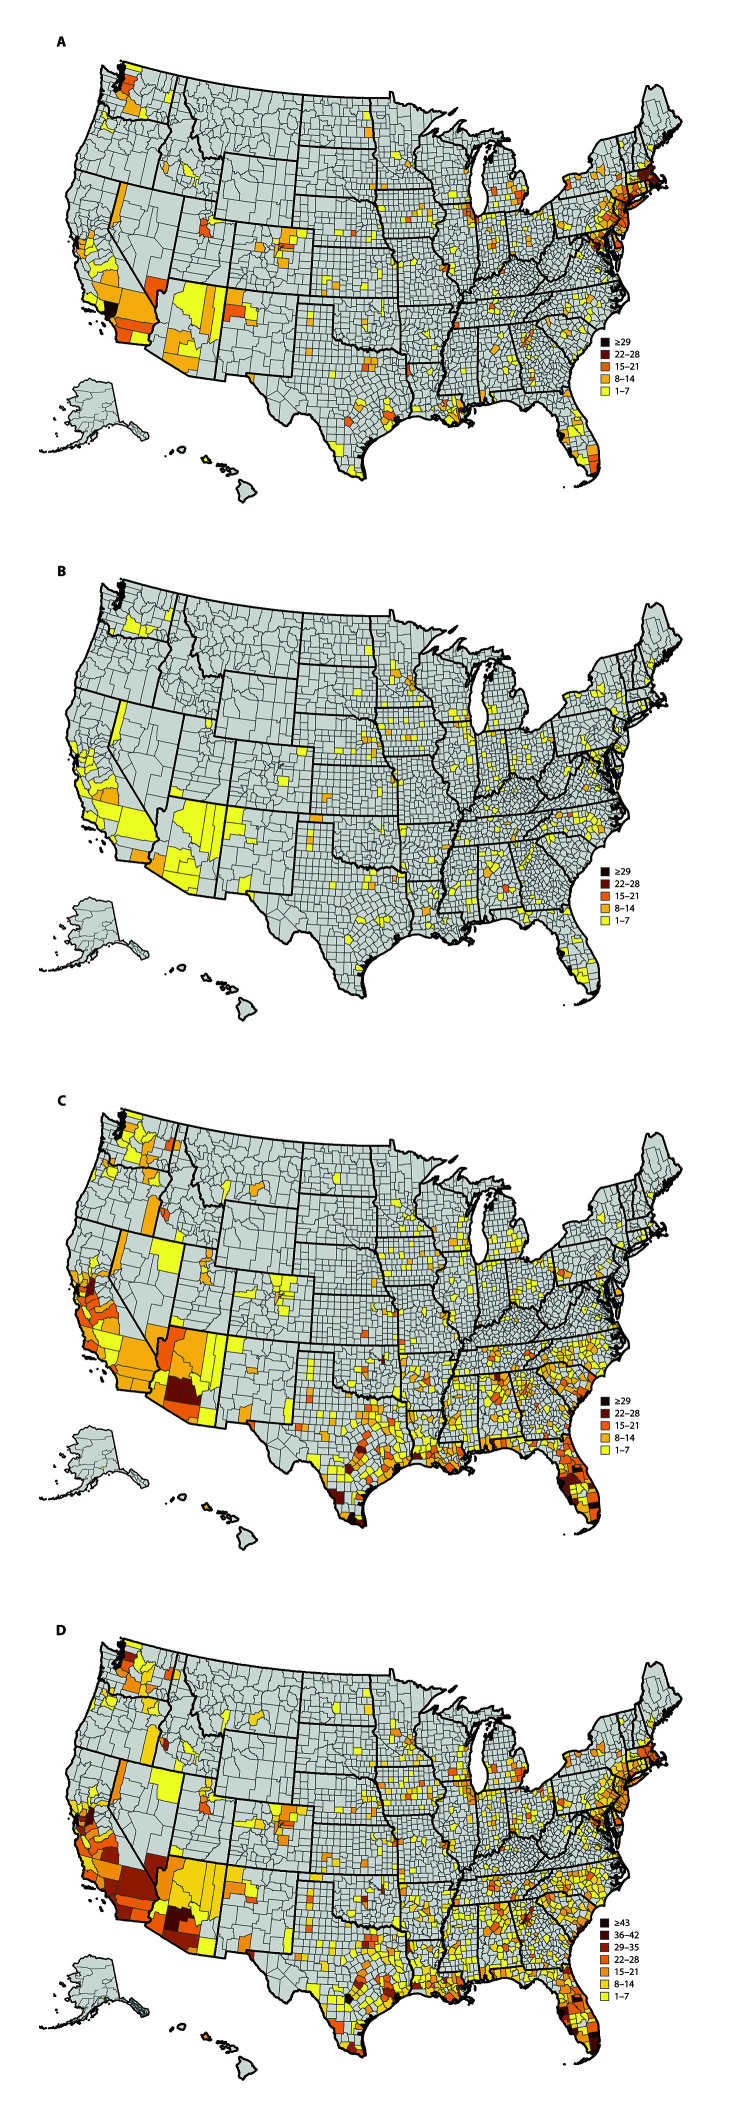
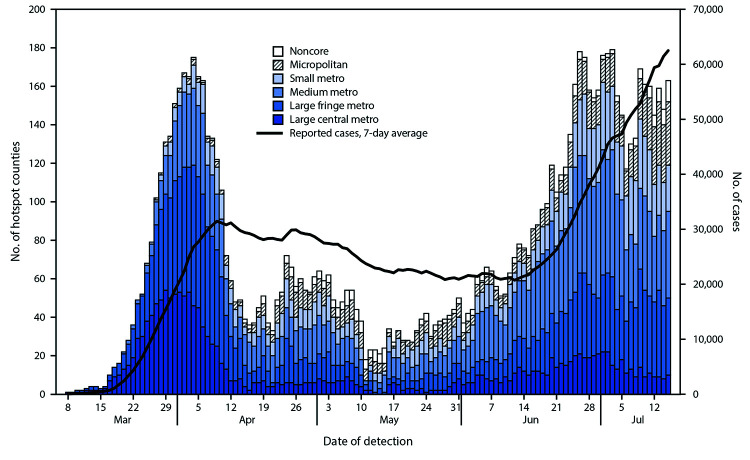
Description:The geographic areas in the United States most affected by the coronaVirus disease 2019 (COVID-19) pandemic have changed over time. On May 7, 2020, CDC, with other federal agencies, began identifying counties with increasing COVID-19 incidence (hotspots) to better understand Transmission dynamics and offer targeted support to health departments in affected communities. Data for January 22-July 15, 2020, were analyzed retrospectively (January 22-May 6) and prospectively (May 7-July 15) to detect hotspot counties. No counties met hotspot criteria during January 22-March 7, 2020. During March 8-July 15, 2020, 818 counties met hotspot criteria for ≥1 day; these counties included 80% of the U.S. population. The daily number of counties meeting hotspot criteria peaked in early April, decreased and stabilized during mid-April-early June, then increased again during late June-early July. The percentage of counties in the South and West Census regions* meeting hotspot criteria increased from 10% and 13%, respectively, during March-April to 28% and 22%, respectively, during June-July. Identification of community Transmission as a contributing factor increased over time, whereas identification of outbreaks in long-term care facilities, food processing facilities, correctional facilities, or other workplaces as contributing factors decreased. Identification of hotspot counties and understanding how they change over time can help prioritize and target implementation of U.S. public health response activities.
-
Subjects:
-
Source:MMWR Morbidity Mortal Weekly Rep. 69(33):1127-1132
-
Series:
-
ISSN:0149-2195 (print) ; 1545-861X (digital)
-
Pubmed ID:32817606
-
Pubmed Central ID:PMC7439980
-
Document Type:
-
Place as Subject:
-
Pages in Document:6 pdf pages
-
Volume:69
-
Issue:33
-
Collection(s):
-
Main Document Checksum:urn:sha-512:50e9fe0dbeca3d4a334cdc6aaf59f2d5396080560b8144e1fd7982e7a81c89c014eac6f19701c32ce6bb6ce285ac9cb68fe5f34b99be0a2723fd11d91891b9f5
-
Download URL:
-
File Type:
 [PDF
- 720.33 KB
]
[PDF
- 720.33 KB
]
Supporting Files

File Language:
English
ON THIS PAGE

CDC STACKS serves as an archival repository of CDC-published products including
scientific findings,
journal articles, guidelines, recommendations, or other public health information authored or
co-authored by CDC or funded partners.
As a repository, CDC STACKS retains documents in their original published format to ensure public access to scientific information.
As a repository, CDC STACKS retains documents in their original published format to ensure public access to scientific information.
You May Also Like
COLLECTION
Morbidity and Mortality Weekly Report (MMWR)