LB19. Patterns of Influenza A Hospitalizations by Subtype and Age in the United States, FluSurv-NET, 2018–2019
Supporting Files
Public Domain

-
October 23 2019
-
Details
-
Alternative Title:Open Forum Infect Dis
-
Personal Author:Garg, Shikha ; O’Halloran, Alissa ; O’Halloran, Alissa ; Cummings, Charisse N ; Cummings, Charisse N ; Holstein, Rachel ; Kniss, Krista ; Anderson, Evan J ; Anderson, Evan J ; Bennett, Nancy M ; Bennett, Nancy M ; Billing, Laurie M ; Billing, Laurie M ; Herlihy, Rachel ; Hill, Mary ; Irizarry, Lourdes ; Irizarry, Lourdes ; Kim, Sue ; Kim, Sue ; Kirley, Pam D ; Lynfield, Ruth ; Lynfield, Ruth ; Monroe, Maya ; Monroe, Maya ; Spina, Nancy ; Talbot, Keipp ; Talbot, Keipp ; Thomas, Ann ; Thomas, Ann ; Yousey-Hindes, Kimberly ; Budd, Alicia ; Brammer, Lynette ; Reed, Carrie ; Reed, Carrie
-
Description:Background
The 2018–19 influenza season was characterized by prolonged co-circulation of Influenza A H3N2 (H3) and H1N1pdm09 (H1) viruses. We used data from the Influenza Hospitalization Surveillance Network (FluSurv-NET) to describe age-related differences in the distribution of influenza A subtypes.
Methods
We included all cases residing within a FluSurv-NET catchment area and hospitalized with laboratory-confirmed influenza during October 1, 2018–April 30, 2019. We multiply imputed influenza A subtype for 63% of cases with unknown subtype and based imputation on factors that could be associated with missing subtype including surveillance site, 10-year age groups and month of hospital admission. We calculated influenza hospitalization rates and 95% confidence intervals (95% CI) by type and subtype per 100,000 population. We compared the proportion of cases with H1 by year of age in FluSurv-NET to the distribution obtained from US public health laboratories participating in virologic surveillance and providing specimen-level influenza Results.
Results
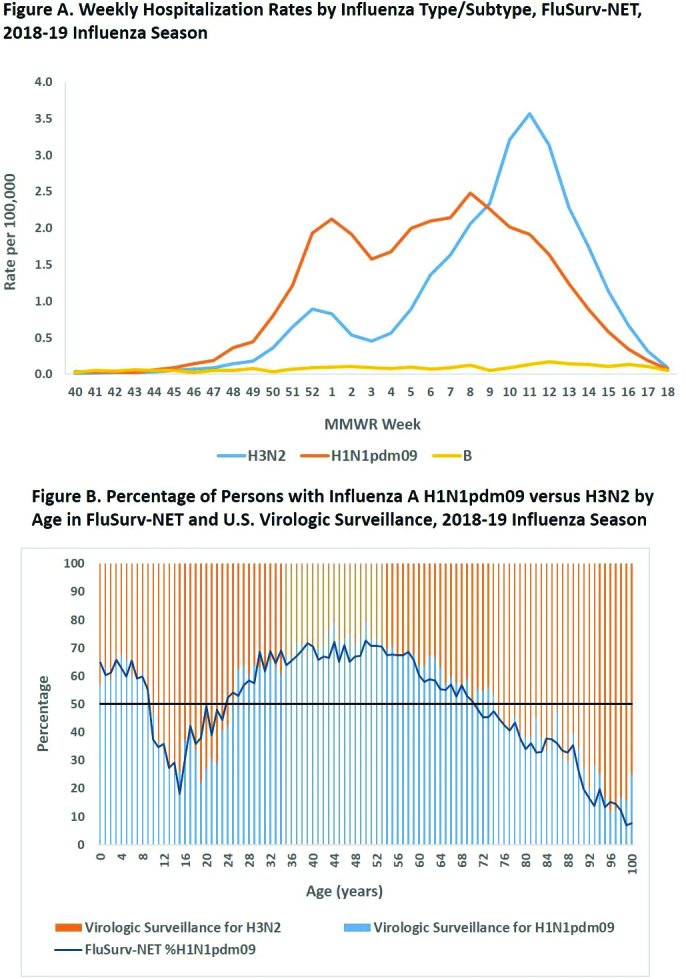
Based on available data, 18,669 hospitalizations were reported; 41% received influenza vaccination ≥2 weeks prior to hospitalization and 90% received antivirals. Cumulative hospitalization rates per 100,000 population were as follows: H1 32.5 (95% CI 31.7–33.3), H3 29.3 (95% CI 28.5–30.1) and B 2.5 (95% CI 2.3–2.7). Based on weekly rates, H1 hospitalizations peaked during February (week 8) and H3 hospitalizations during March (week 11) (Figure A). FluSurv-NET data showed distinct patterns of subtype distribution by age, with H1 predominating among cases 0–9 and 24–70 years, and H3 predominating among cases 10–23 and ≥71 years. Data on the proportion of H1 results by age correlated well between FluSurv-NET and US virologic surveillance (Figure B).
Conclusion
Influenza A H1 and H3 virus circulation patterns varied by age group during the 2018–2019 season. The proportion of cases with H1 relative to H3 was low among those born between 1996 and 2009 and those born before 1948. These findings may indicate protection against H1 viruses in age groups with exposure to H1N1pdm09 during the 2009 pandemic or to older antigenically similar H1N1 viruses as young children.
Disclosures
Evan J. Anderson, MD, AbbVie (Consultant), GSK (Grant/Research Support), Merck (Grant/Research Support), Micron (Grant/Research Support), PaxVax (Grant/Research Support), Pfizer (Consultant, Grant/Research Support), sanofi pasteur (Grant/Research Support), Keipp Talbot, MD, MPH, Sequirus (Other Financial or Material Support, On Data Safety Monitoring Board).
-
Subjects:
-
Source:Open Forum Infect Dis. 2019; 6(Suppl 2):S1001-S1002
-
Pubmed Central ID:PMC6810298
-
Document Type:
-
Volume:6
-
Collection(s):
-
Main Document Checksum:urn:sha256:0dc739dec4de7f28963d6dd39eb15a0cb51c09f5e91264b7cbf4819a412c1a23
-
Download URL:
-
File Type:
 [PDF
- 1.45 MB
]
[PDF
- 1.45 MB
]
Supporting Files

ON THIS PAGE

CDC STACKS serves as an archival repository of CDC-published products including
scientific findings,
journal articles, guidelines, recommendations, or other public health information authored or
co-authored by CDC or funded partners.
As a repository, CDC STACKS retains documents in their original published format to ensure public access to scientific information.
As a repository, CDC STACKS retains documents in their original published format to ensure public access to scientific information.
You May Also Like
COLLECTION
CDC Public Access