County-Level Trends in Suicide Rates in the U.S., 2005–2015
Supporting Files

-
7 2018
-
File Language:
English
Details
-
Alternative Title:Am J Prev Med
-
Personal Author:
-
Description:Introduction
Understanding the geographic patterns of suicide can help inform targeted prevention efforts. Although state-level variation in age-adjusted suicide rates has been well documented, trends at the county-level have been largely unexplored. This study uses small area estimation to produce stable county-level estimates of suicide rates to examine geographic, temporal, and urban–rural patterns in suicide from 2005 to 2015.
Methods
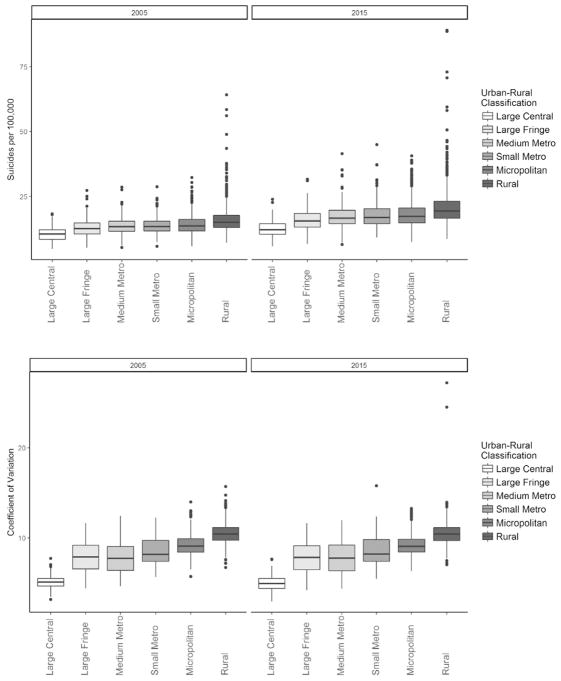
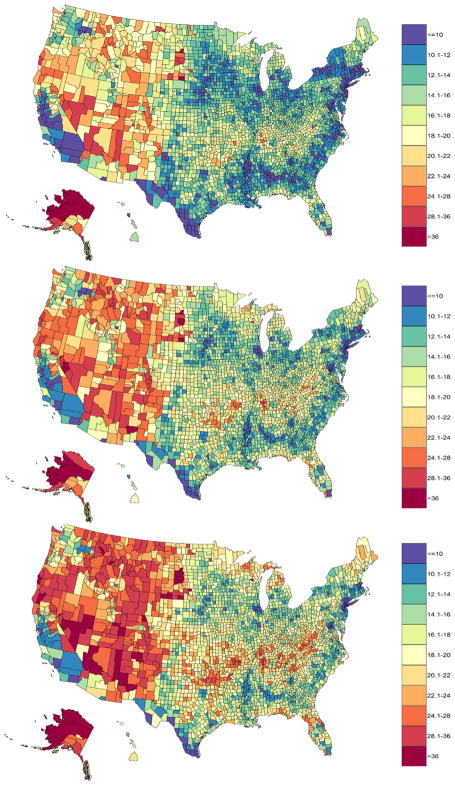
Using National Vital Statistics Underlying Cause of Death Files (2005–2015), hierarchical Bayesian models were used to estimate suicide rates for 3,140 counties. Model-based suicide rate estimates were mapped to explore geographic and temporal patterns and examine urban–rural differences. Analyses were conducted in 2016–2017.
Results
Posterior predicted mean county-level suicide rates increased by >10% from 2005 to 2015 for 99% of counties in the U.S., with 87% of counties showing increases of >20%. Counties with the highest model-based suicide rates were consistently located across the western and northwestern U.S., with the exception of southern California and parts of Washington. Compared with more urban counties, more rural counties had the highest estimated suicide rates from 2005 to 2015, and also the largest increases over time.
Conclusions
Mapping county-level suicide rates provides greater granularity in describing geographic patterns of suicide and contributes to a better understanding of changes in suicide rates over time. Findings may inform more targeted prevention efforts as well as future research on community-level risk and protective factors related to suicide mortality.
-
Subjects:
-
Source:Am J Prev Med. 55(1):72-79
-
Pubmed ID:29773489
-
Pubmed Central ID:PMC6038117
-
Document Type:
-
Funding:
-
Volume:55
-
Issue:1
-
Collection(s):
-
Main Document Checksum:urn:sha256:547aa83ec8931356c7a3476db6bafc788b442b756d0c83861a141fd7910f17f2
-
Download URL:
-
File Type:
 [PDF
- 1.20 MB
]
[PDF
- 1.20 MB
]
Supporting Files

File Language:
English
ON THIS PAGE

CDC STACKS serves as an archival repository of CDC-published products including
scientific findings,
journal articles, guidelines, recommendations, or other public health information authored or
co-authored by CDC or funded partners.
As a repository, CDC STACKS retains documents in their original published format to ensure public access to scientific information.
As a repository, CDC STACKS retains documents in their original published format to ensure public access to scientific information.
You May Also Like
COLLECTION
CDC Public Access