Urinary Bisphenol A (BPA) Concentrations among Workers in Industries that Manufacture and Use BPA in the USA
Supporting Files

-
3 01 2017
-
File Language:
English
Details
-
Alternative Title:Ann Work Expo Health
-
Personal Author:
-
Description:Background
Bisphenol A (BPA) toxicity and exposure risk to humans has been the subject of considerable scientific debate; however, published occupational exposure data for BPA are limited.
Methods
In 2013–2014, 77 workers at six US companies making BPA, BPA-based resins, or BPA-filled wax provided seven urine samples over two consecutive work days (151 worker-days, 525 samples). Participant information included industry, job, tasks, personal protective equipment used, hygiene behaviors, and canned food/beverage consumption. Total (free plus conjugated) BPA, quantified in urine by mass spectrometry, was detected in all samples.
Results
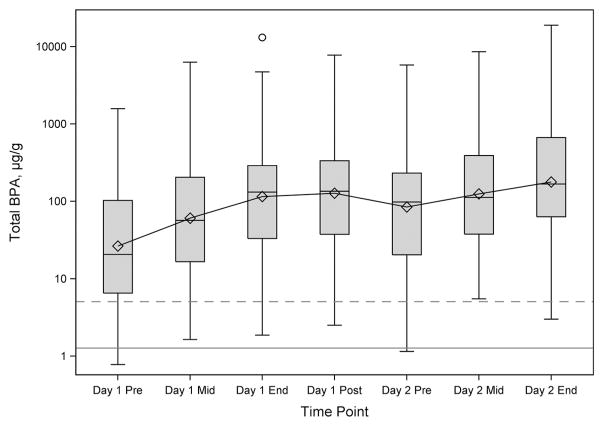
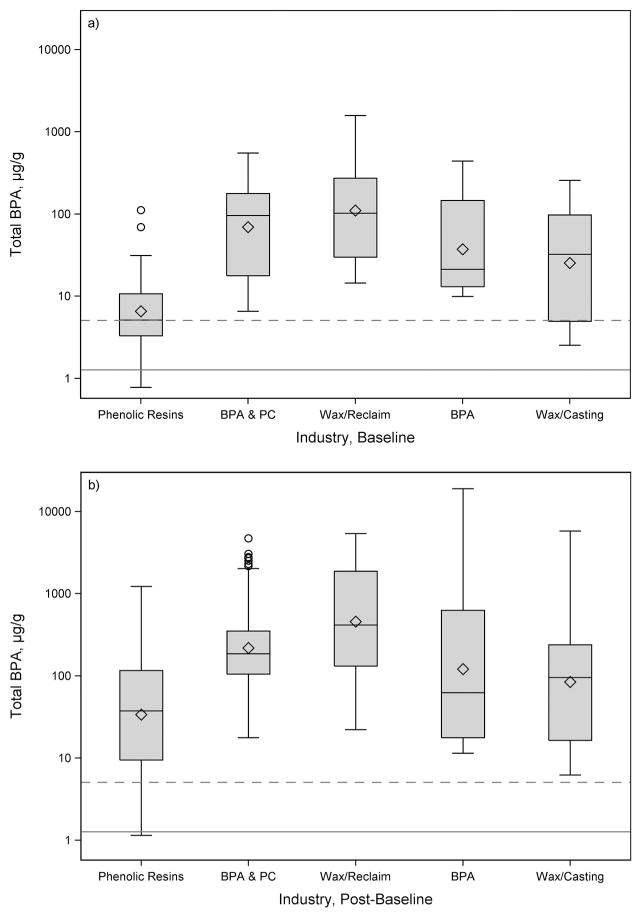
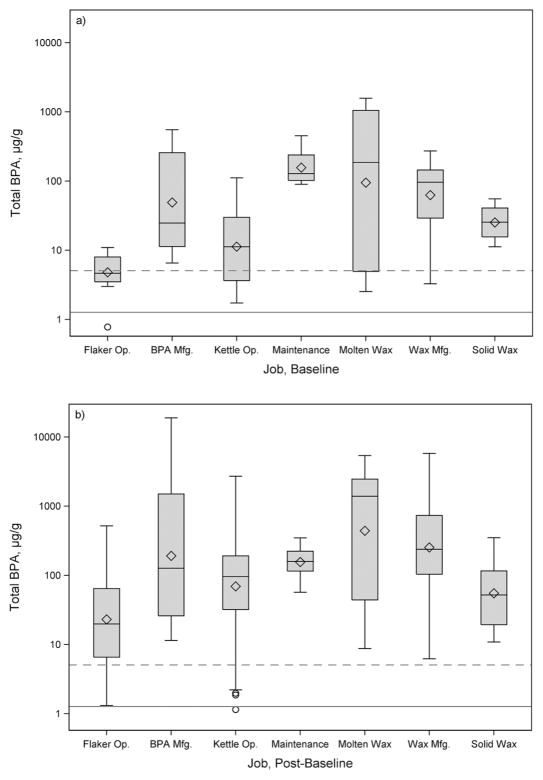
The geometric mean (GM) creatinine-adjusted total BPA (total BPACR) concentration was 88.0 μg g−1 (range 0.78–18 900 μg g−1), ~70 times higher than in US adults in 2013–2014 (1.27 μg g−1). GM total BPACR increased during Day 1 (26.6–127 μg g−1), decreased by pre-shift Day 2 (84.4 μg g−1) then increased during Day 2 to 178 μg g−1. By industry, baseline and post-baseline total BPACR was highest in BPA-filled wax manufacturing/reclaim (GM = 111 μg g−1) and lowest in phenolic resin manufacturing (GM = 6.56 μg g−1). By job, total BPACR was highest at baseline in maintenance workers (GM = 157 μg g−1) and post-baseline in those working with molten BPA-filled wax (GM = 441 μg g−1). Workers in the job of flaking a BPA-based resin had the lowest concentrations at baseline (GM = 4.81 μg g−1) and post-baseline (GM = 23.2 μg g−1). In multiple regression models, at baseline, industry significantly predicted increased total BPACR (P = 0.0248); post-baseline, handling BPA containers (P = 0.0035), taking ≥3 process/bulk samples with BPA (P = 0.0002) and wearing a Tyvek® coverall (P = 0.0042) significantly predicted increased total BPACR (after adjusting for total BPACR at baseline, time point, and body mass index).
Conclusion
Several work-related factors, including industry, job, and certain tasks performed, were associated with increased urinary total BPACR concentrations in this group of manufacturing workers. The potential for BPA-related health effects among these workers is unknown.
-
Subjects:
-
Keywords:
-
Source:Ann Work Expo Health. 61(2):164-182
-
Pubmed ID:28395354
-
Pubmed Central ID:PMC5577557
-
Document Type:
-
Funding:
-
Volume:61
-
Issue:2
-
Collection(s):
-
Main Document Checksum:urn:sha256:e986f76d15b6c20976ad5b762aba2dacdac6fc00657febd076a3e297d061c915
-
Download URL:
-
File Type:
 [PDF
- 783.06 KB
]
[PDF
- 783.06 KB
]
Supporting Files

File Language:
English
ON THIS PAGE

CDC STACKS serves as an archival repository of CDC-published products including
scientific findings,
journal articles, guidelines, recommendations, or other public health information authored or
co-authored by CDC or funded partners.
As a repository, CDC STACKS retains documents in their original published format to ensure public access to scientific information.
As a repository, CDC STACKS retains documents in their original published format to ensure public access to scientific information.
You May Also Like
COLLECTION
CDC Public Access