Correlation between X-ray diffraction and Raman spectra of 16 commercial graphene—based materials and their resulting classification
Supporting Files

-
Oct 08 2016
-
Details
-
Alternative Title:Carbon N Y
-
Personal Author:
-
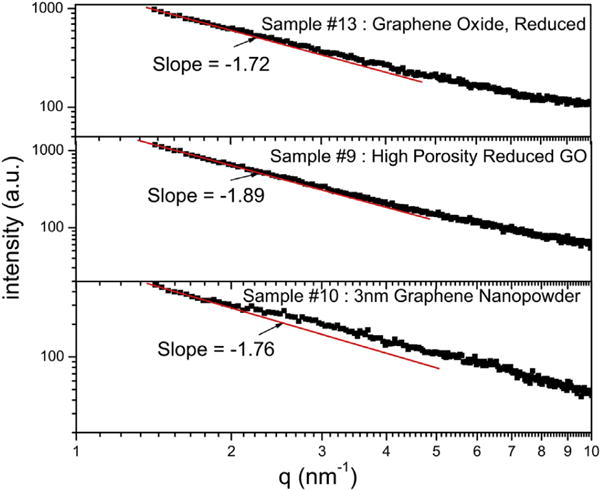
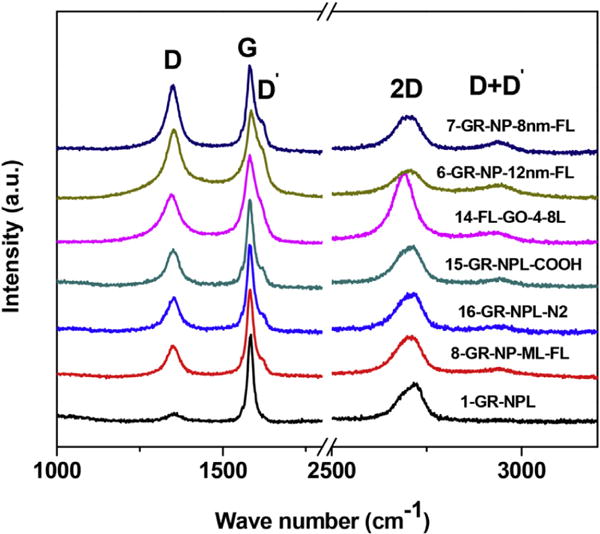
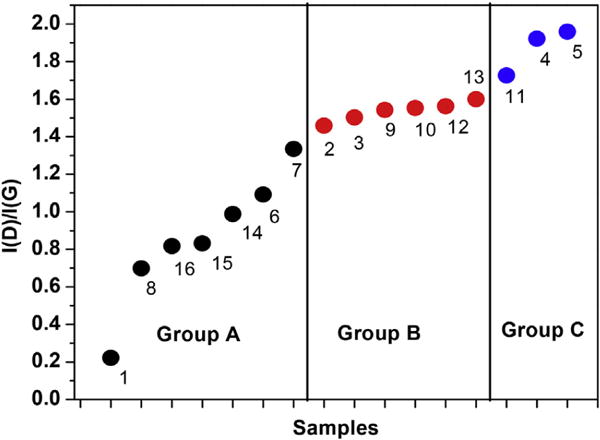
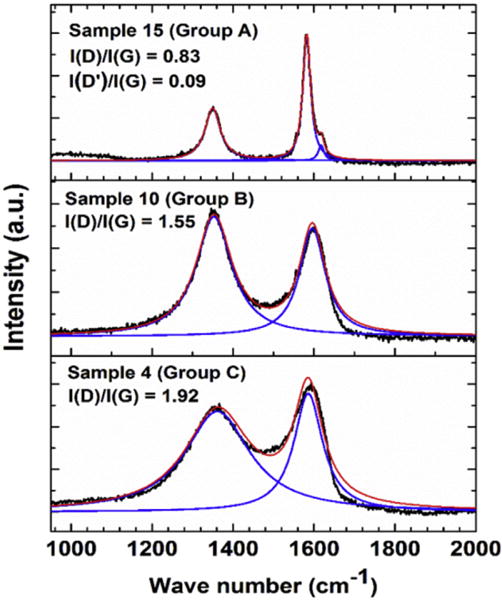
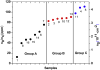
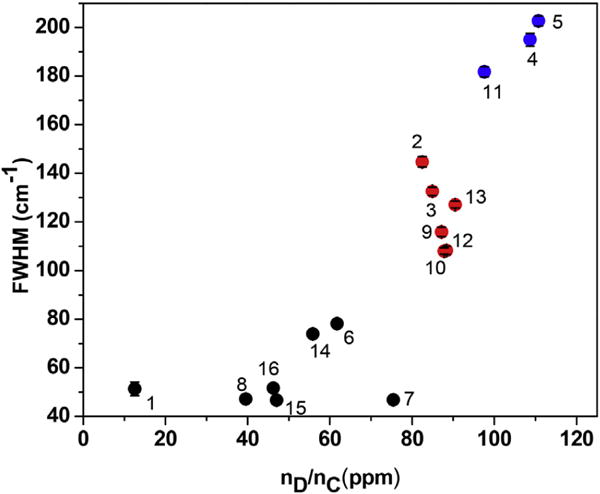
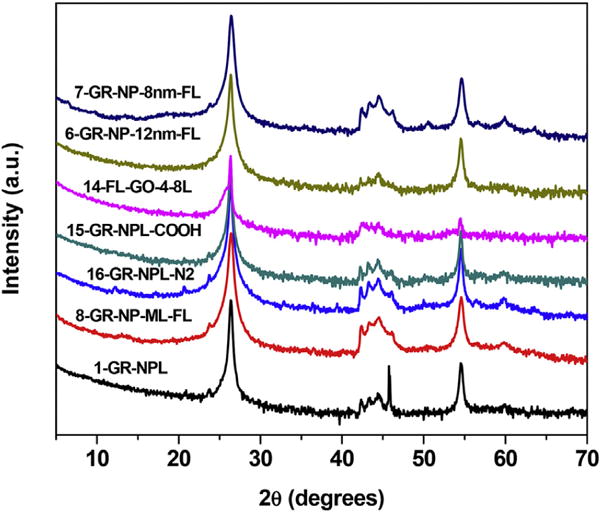
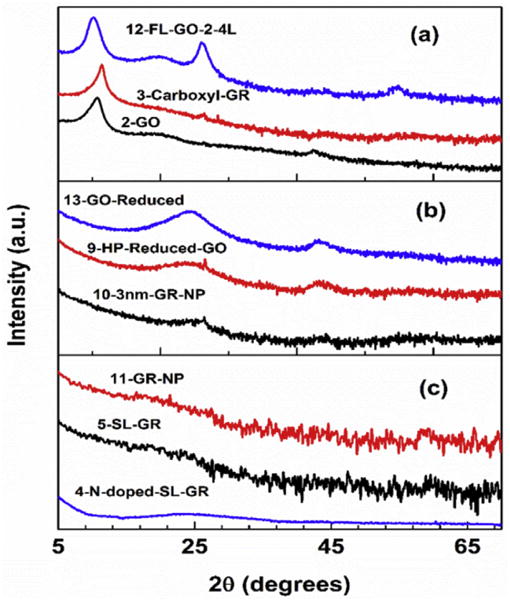
Description:Structural properties of sixteen (16) commercial samples of graphene-based materials (GBM) labelled as graphene, graphene oxide or reduced graphene oxide are investigated at room temperature using X-ray diffraction (XRD) and Raman spectroscopy. Based on the observed correlation between the results obtained with these two techniques, these samples are classified into three groups: Group A of seven samples consisting of graphitic nanosheets with evaluated thickness ≃20 nm and exhibiting both the 2H and 3R phases in XRD; Group B of six samples exhibiting XRD spectra characteristic of either graphene oxides (GO) or carbons with some order; and Group C of three samples with XRD spectra characteristic of disordered carbons. The relative intensities and widths of D, G, D', 2D and (D + D') bands in the Raman spectra are equally distinguishable between the samples in groups A, B and C. The width of the D-band is the smallest for Group A samples, intermediate for group B and the largest for group C samples. The intensity ratio I(D)/I(G) of the D and G bands in the Raman spectra of the samples is used to quantify the Raman-active defects whose concentration increases in going from samples in Group A to those in Group C.
-
Subjects:
-
Source:Carbon N Y. 111:380-384.
-
Pubmed ID:28690336
-
Pubmed Central ID:PMC5497829
-
Document Type:
-
Funding:
-
Volume:111
-
Collection(s):
-
Main Document Checksum:urn:sha256:a140a66c969db2b906adcf15fb8e8fcad853ea6e4b1883010aa6f811c7da787b
-
Download URL:
-
File Type:
 [PDF
- 833.79 KB
]
[PDF
- 833.79 KB
]
Supporting Files

ON THIS PAGE

CDC STACKS serves as an archival repository of CDC-published products including
scientific findings,
journal articles, guidelines, recommendations, or other public health information authored or
co-authored by CDC or funded partners.
As a repository, CDC STACKS retains documents in their original published format to ensure public access to scientific information.
As a repository, CDC STACKS retains documents in their original published format to ensure public access to scientific information.
You May Also Like
COLLECTION
CDC Public Access