i
Using Spatial Analysis to Inform Community Immunization Strategies
-
Mar 30 2017
-
-
Source: Biomed Inform Insights. 2017; 9.
 [PDF-1.92 MB]
Details:
-
Alternative Title:Biomed Inform Insights
-
Personal Author:
-
Description:Introduction:
Recent pertussis outbreaks in the United States suggest our response to local disease outbreaks (eg, vaccine-preventable Bordetella pertussis) may benefit from understanding and applying spatial analytical methods that use data from immunization information systems at a subcounty level.
Methods:
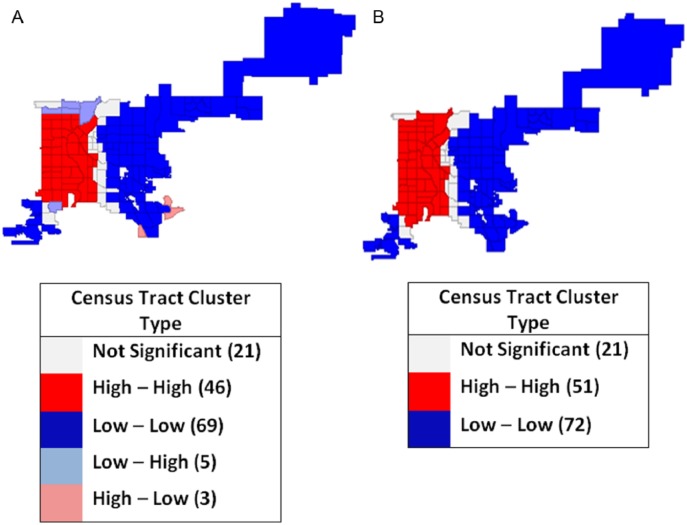
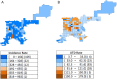
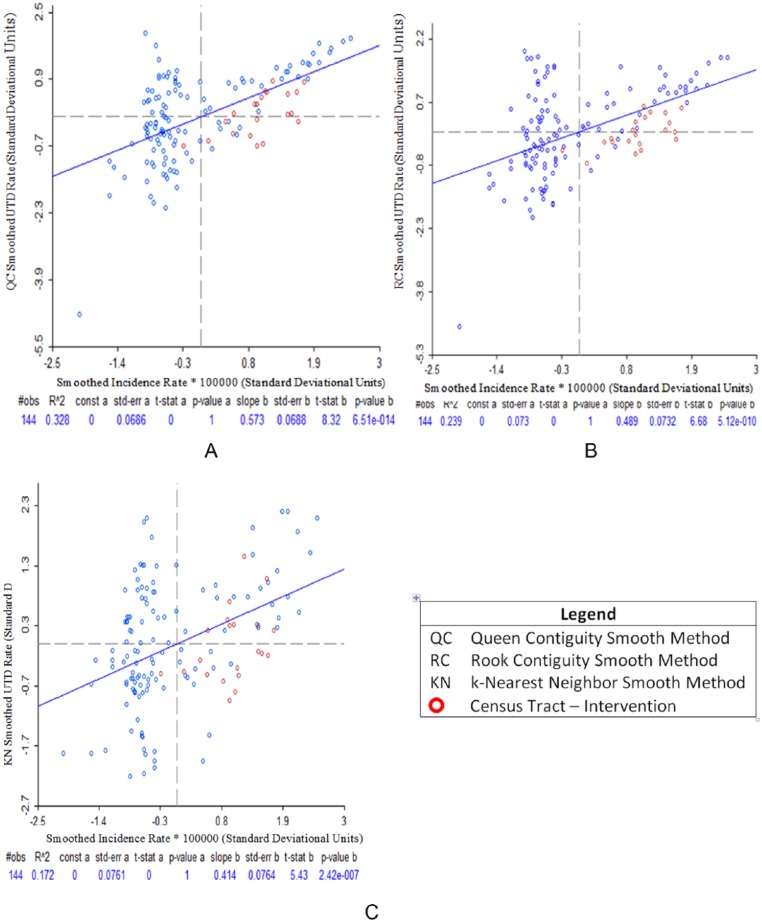
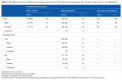
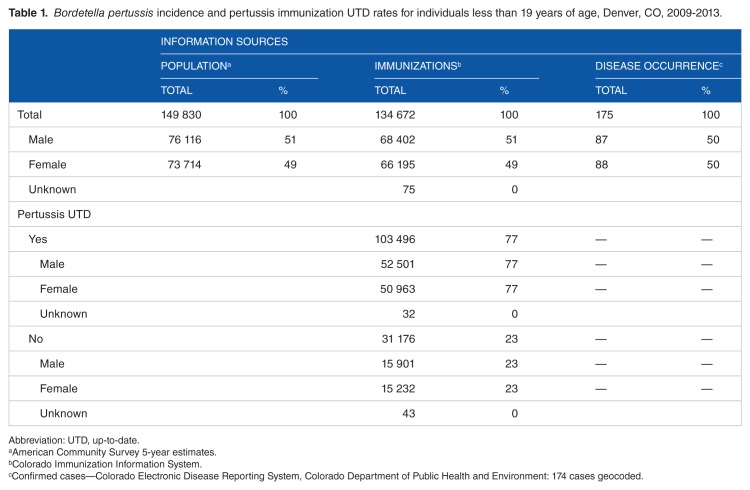
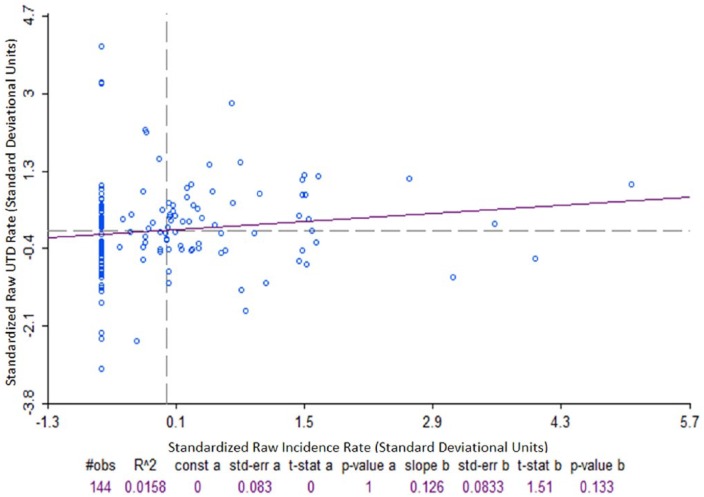
A 2012 study on Denver, CO, residents less than 19 years of age confirmed pertussis cases and immunization information system records were geocoded and aggregated to the census tract (CT) level. An algorithm assessed whether individuals were up-to-date (UTD) for pertussis vaccines. Pearson, Spearman, and Kendall correlations assessed relations between disease incidence and pertussis vaccine coverage. Using spatial analysis software, disease incidence and UTD rates were spatially weighted, and smoothed. Global and local autocorrelations based on univariate Moran’s I spatial autocorrelation statistics evaluated whether a CT’s rate belong to a cluster based on incidence or UTD measures.
Results:
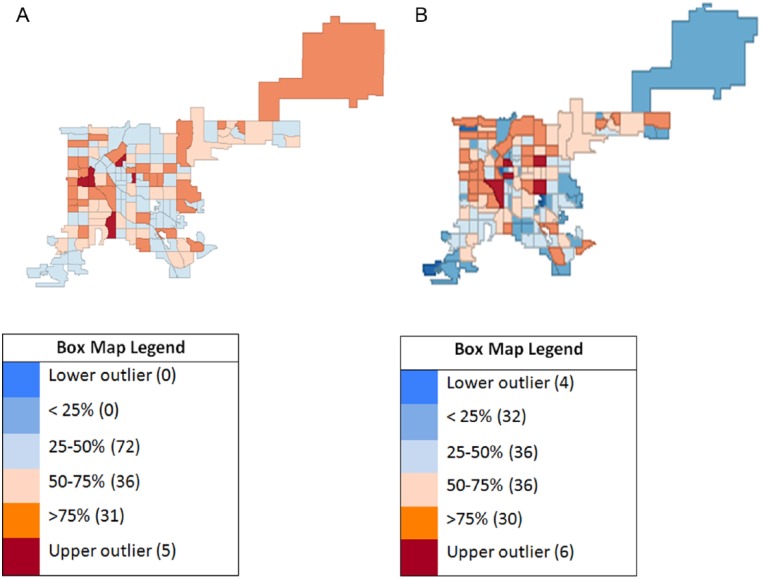
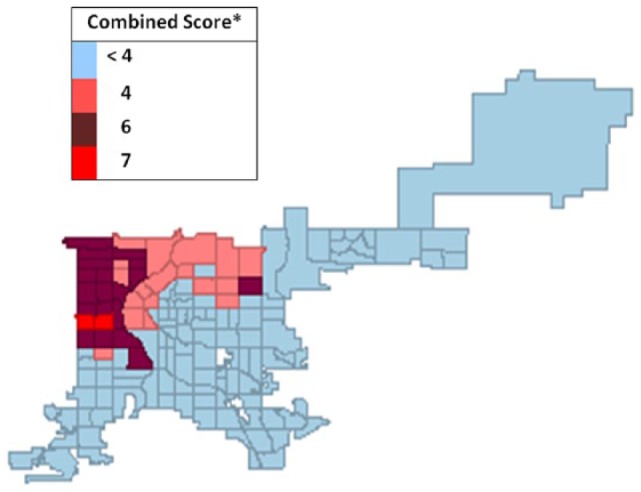
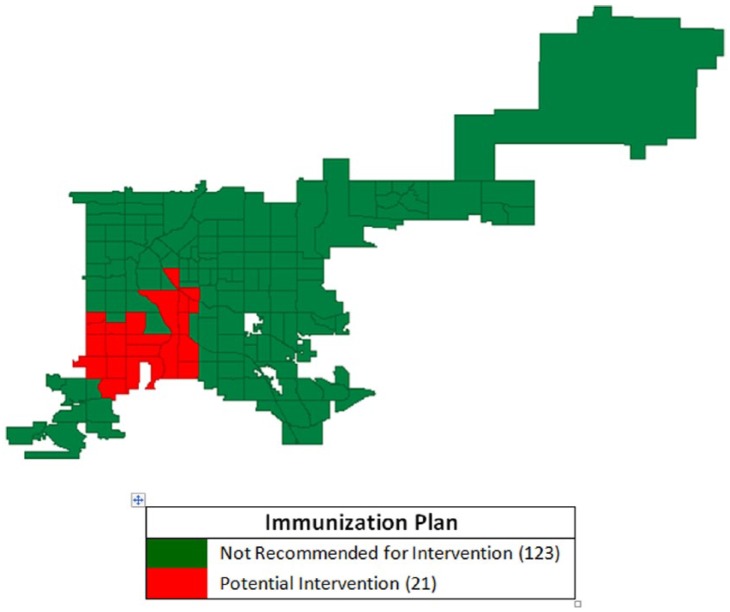
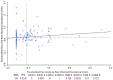
Overall disease incidence rate was 116.8/100 000. Assessment of pertussis vaccination coverage was available for 90% of the population. Among 134 672 Denver residents less than 19 years old, 103 496 (77%) were UTD for pertussis vaccines. Raw correlation coefficients showed weak relationships between incidence and immunization rates due to the presence of outliers. With geospatial and clustering analysis, estimates and correlation coefficients were improved with statistically significant Moran’s I values for global and local autocorrelations rejecting the null hypothesis that incidence or UTD rates were randomly distributed. With evidence indicating the presence of clusters, smoothed and weighted disease incidence and UTD rates in 144 CTs identified 21 CTs (15%) for potential public health intervention.
Conclusions:
Correlation of raw disease incidence and vaccine UTD rates in subcounty regions showed limited association, providing limited information for decision making. By assessing for clusters using spatial analysis methods, we identified CTs with higher incidence and lower immunization coverage for targeted public health interventions.
-
Subjects:
-
Source:
-
Pubmed ID:28469433
-
Pubmed Central ID:PMC5391195
-
Document Type:
-
Funding:
-
Collection(s):
-
Main Document Checksum:
-
Download URL:
-
File Type:
Supporting Files
-

gif
jpeg
gif
jpeg
gif
jpeg
gif
jpeg
gif
jpeg
gif
gif
jpeg
gif
jpeg
gif
jpeg
bin
jpeg
gif
jpeg
gif
jpeg
gif
jpeg

