Trends and Geographic Patterns in Drug-Poisoning Death Rates in the U.S., 1999–2009
Supporting Files

-
Dec 2013
File Language:
English
Details
-
Alternative Title:Am J Prev Med
-
Personal Author:
-
Description:Background
Drug poisoning mortality has increased substantially in the U.S. over the past 3 decades. Previous studies have described state-level variation and urban–rural differences in drug-poisoning deaths, but variation at the county level has largely not been explored in part because crude county-level death rates are often highly unstable.
Purpose
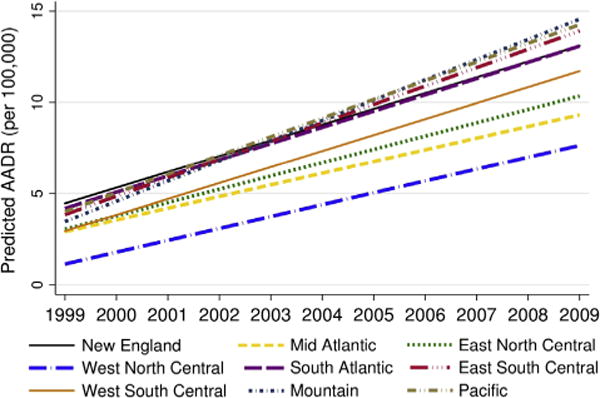
The goal of the study was to use small-area estimation techniques to produce stable county-level estimates of age-adjusted death rates (AADR) associated with drug poisoning for the U.S., 1999–2009, in order to examine geographic and temporal variation.
Methods
Population-based observational study using data on 304,087 drug-poisoning deaths in the U.S. from the 1999–2009 National Vital Statistics Multiple Cause of Death Files (analyzed in 2012). Because of the zero-inflated and right-skewed distribution of drug-poisoning death rates, a two-stage modeling procedure was used in which the first stage modeled the probability of observing a death for a given county and year, and the second stage modeled the log-transformed drug-poisoning death rate given that a death occurred. Empirical Bayes estimates of county-level drug-poisoning death rates were mapped to explore temporal and geographic variation.
Results
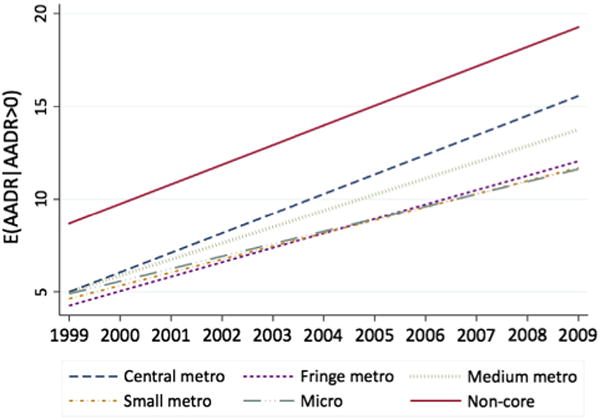
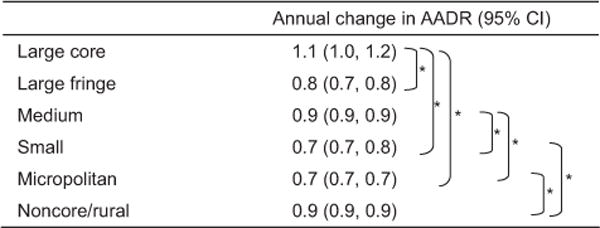
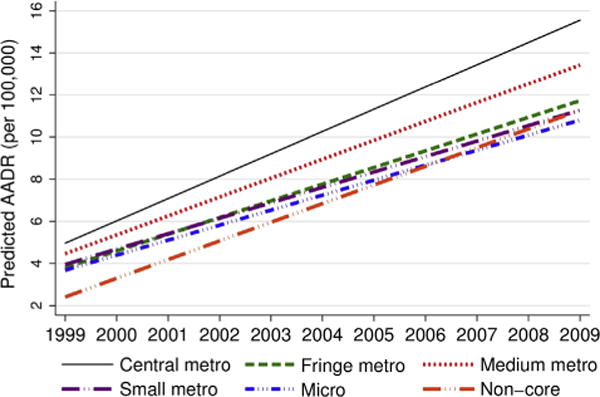
Only 3% of counties had drug-poisoning AADRs greater than ten per 100,000 per year in 1999–2000, compared to 54% in 2008–2009. Drug-poisoning AADRs grew by 394% in rural areas compared to 279% for large central metropolitan counties, but the highest drug-poisoning AADRs were observed in central metropolitan areas from 1999 to 2009.
Conclusions
There was substantial geographic variation in drug-poisoning mortality across the U.S.
-
Subjects:
-
Source:Am J Prev Med. 45(6):e19-e25.
-
Pubmed ID:24237925
-
Pubmed Central ID:PMC4659504
-
Document Type:
-
Funding:
-
Place as Subject:
-
Volume:45
-
Issue:6
-
Collection(s):
-
Main Document Checksum:urn:sha256:2297f5451920df3593e8c3332d28934a2df6d1ae09fe94d28ceb4ccb27599d9d
-
Download URL:
-
File Type:
 [PDF
- 353.34 KB
]
[PDF
- 353.34 KB
]
Supporting Files

File Language:
English
ON THIS PAGE

CDC STACKS serves as an archival repository of CDC-published products including
scientific findings,
journal articles, guidelines, recommendations, or other public health information authored or
co-authored by CDC or funded partners.
As a repository, CDC STACKS retains documents in their original published format to ensure public access to scientific information.
As a repository, CDC STACKS retains documents in their original published format to ensure public access to scientific information.
You May Also Like
COLLECTION
CDC Public Access