Identification of Hypertension Predictors and Application to Hypertension Prediction in an Urban Han Chinese Population: A Longitudinal Study, 2005–2010
Supporting Files
Public Domain

-
Oct 29 2015
-
File Language:
English
Details
-
Journal Article:Preventing Chronic Disease (PCD)
-
Personal Author:
-
Description:Introduction
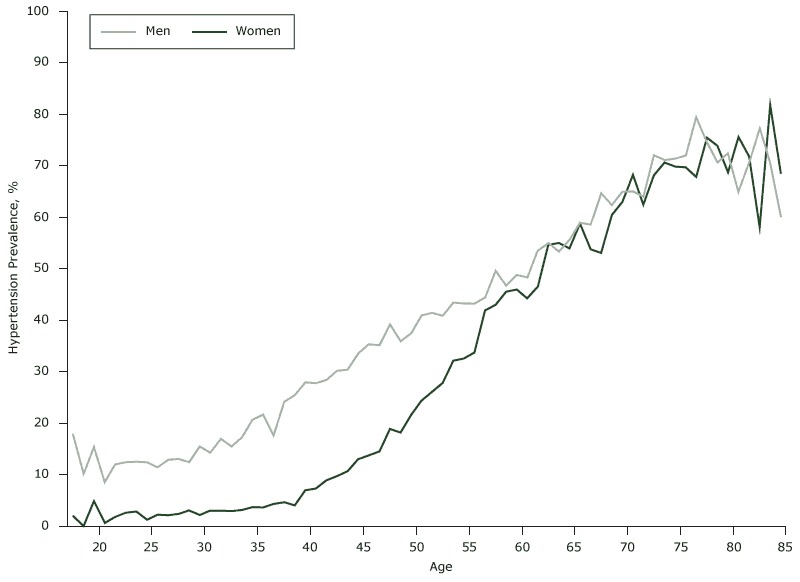
Research suggests that targeting high-risk, nonhypertensive patients for preventive intervention may delay the onset of hypertension. We aimed to develop a biomarker-based risk prediction model for assessing hypertension risk in an urban Han Chinese population.
Methods
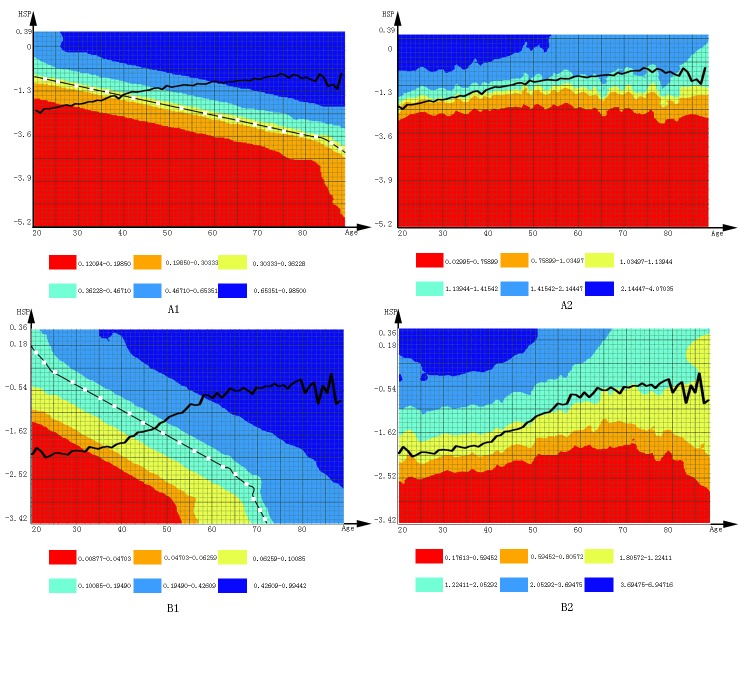
We analyzed data from 26,496 people with hypertension to extract factors from 11 check-up biomarkers. Then, depending on a 5-year follow-up cohort, a Cox model for predicting hypertension development was built by using extracted factors as predictors. Finally, we created a hypertension synthetic predictor (HSP) by weighting each factor with its risk for hypertension to develop a risk assessment matrix.
Results
After factor analysis, 5 risk factors were extracted from data for both men and women. After a 5-year follow-up, the cohort of participants had an area under receiver operating characteristic curve (area under the curve [AUC]) with an odds ratio (OR) of 0.755 (95% confidence interval [CI], 0.746–0.763) for men and an OR of 0.801 (95% CI, 0.792–0.810) for women. After tenfold cross validation, the AUC was still high, with 0.755 (95% CI, 0.746–0.763) for men and 0.800 (95% CI, 0.791–0.810) for women. An HSP-based 5-year risk matrix provided a convenient tool for risk appraisal.
Conclusion
Hypertension could be explained by 5 factors in a population sample of Chinese urban Han. The HSP may be useful in predicting hypertension.
-
Subjects:
-
Source:Prev Chronic Dis. 12.
-
DOI:
-
ISSN:1545-1151
-
Pubmed ID:26513440
-
Pubmed Central ID:PMC4663898
-
Document Type:
-
Place as Subject:
-
Volume:12
-
Collection(s):
-
Main Document Checksum:urn:sha-512:2884bc2accc109d4d9be81a6776642a0d7e9009cab5f342859eb49c4e153f83dc720e5745eb97c8b77b706d94dba4f47e1bb108639723062e3ceba02e2bcd6e4
-
Download URL:
-
File Type:
 [PDF
- 563.55 KB
]
[PDF
- 563.55 KB
]
Supporting Files

File Language:
English
ON THIS PAGE

CDC STACKS serves as an archival repository of CDC-published products including
scientific findings,
journal articles, guidelines, recommendations, or other public health information authored or
co-authored by CDC or funded partners.
As a repository, CDC STACKS retains documents in their original published format to ensure public access to scientific information.
As a repository, CDC STACKS retains documents in their original published format to ensure public access to scientific information.
You May Also Like
COLLECTION
Preventing Chronic Disease