Evaluation of sliding baseline methods for spatial estimation for cluster detection in the biosurveillance system
Supporting Files
Public Domain

-
Jul 17 2009
-
Details
-
Alternative Title:Int J Health Geogr
-
Personal Author:
-
Description:Background
The Centers for Disease Control and Prevention's (CDC's) BioSense system provides near-real time situational awareness for public health monitoring through analysis of electronic health data. Determination of anomalous spatial and temporal disease clusters is a crucial part of the daily disease monitoring task. Our study focused on finding useful anomalies at manageable alert rates according to available BioSense data history.
Methods
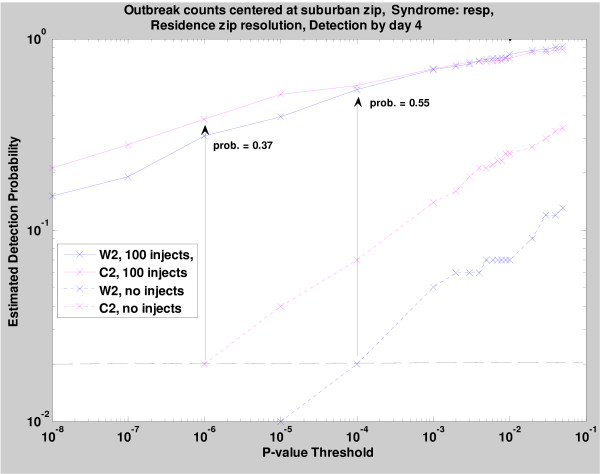
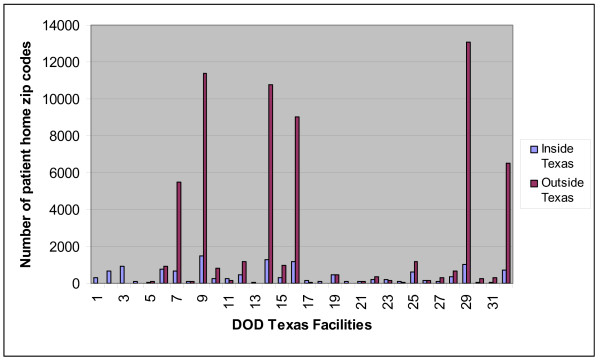
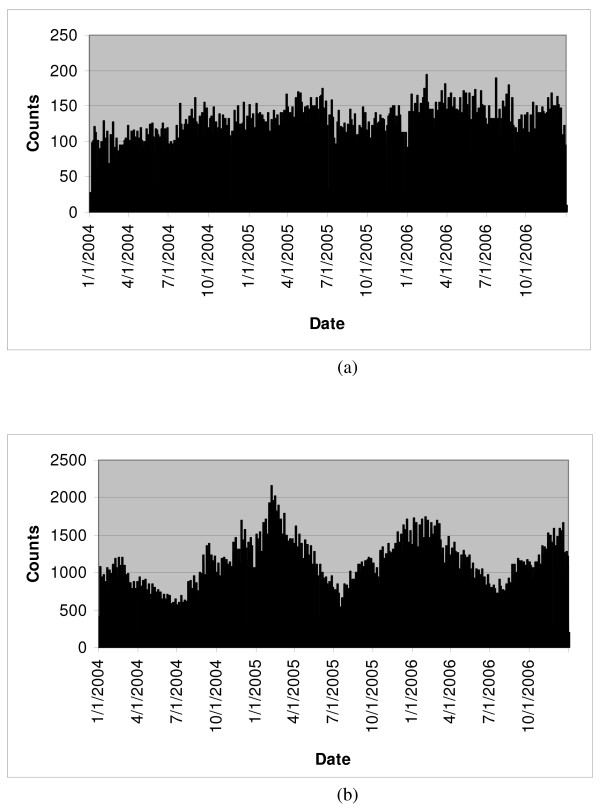
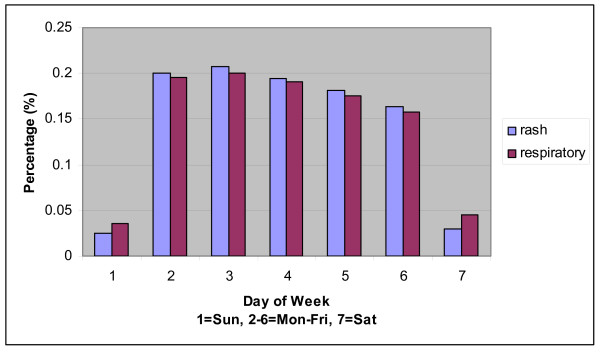
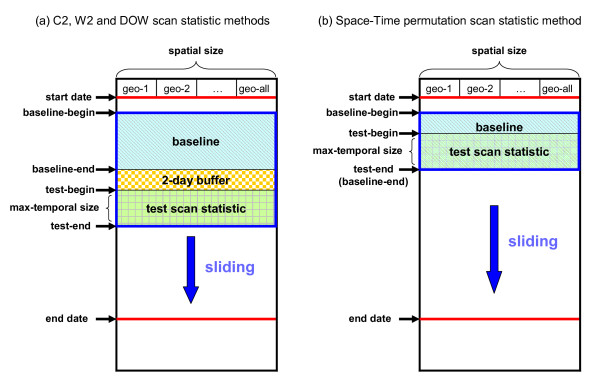
The study dataset included more than 3 years of daily counts of military outpatient clinic visits for respiratory and rash syndrome groupings. We applied four spatial estimation methods in implementations of space-time scan statistics cross-checked in Matlab and C. We compared the utility of these methods according to the resultant background cluster rate (a false alarm surrogate) and sensitivity to injected cluster signals. The comparison runs used a spatial resolution based on the facility zip code in the patient record and a finer resolution based on the residence zip code.
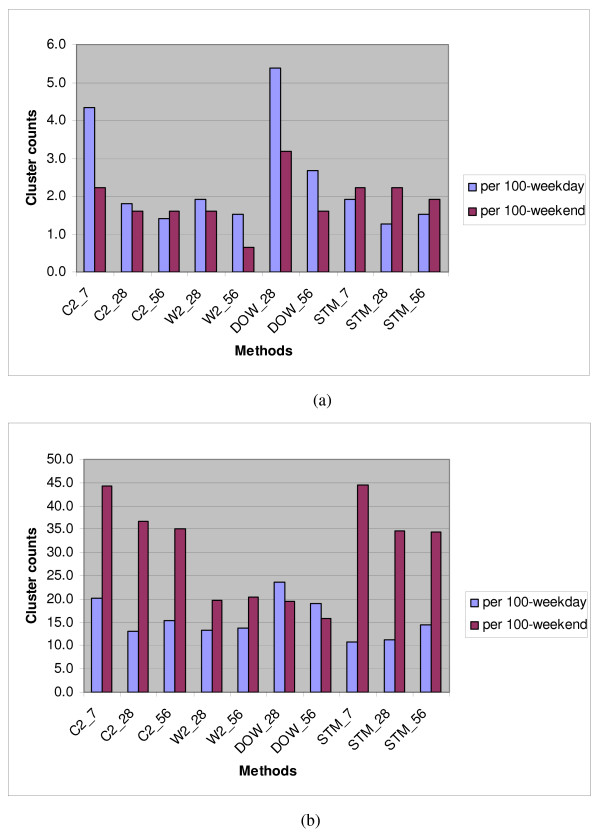
Results
Simple estimation methods that account for day-of-week (DOW) data patterns yielded a clear advantage both in background cluster rate and in signal sensitivity. A 28-day baseline gave the most robust results for this estimation; the preferred baseline is long enough to remove daily fluctuations but short enough to reflect recent disease trends and data representation. Background cluster rates were lower for the rash syndrome counts than for the respiratory counts, likely because of seasonality and the large scale of the respiratory counts.
Conclusion
The spatial estimation method should be chosen according to characteristics of the selected data streams. In this dataset with strong day-of-week effects, the overall best detection performance was achieved using subregion averages over a 28-day baseline stratified by weekday or weekend/holiday behavior. Changing the estimation method for particular scenarios involving different spatial resolution or other syndromes can yield further improvement.
-
Subjects:
-
Source:Int J Health Geogr. 2009; 8:45.
-
Document Type:
-
Volume:8
-
Collection(s):
-
Main Document Checksum:urn:sha-512:9ac2bf302afdf6d8b49f07fc0d0acc610a6a6b4fc35278d0c87d108784d8ea9e61f1ceb788cd4192bd949a44f8fd4be4d3ef7caf8b48917db953f2380cbb527e
-
Download URL:
-
File Type:
 [PDF
- 410.98 KB
]
[PDF
- 410.98 KB
]
Supporting Files

ON THIS PAGE

CDC STACKS serves as an archival repository of CDC-published products including
scientific findings,
journal articles, guidelines, recommendations, or other public health information authored or
co-authored by CDC or funded partners.
As a repository, CDC STACKS retains documents in their original published format to ensure public access to scientific information.
As a repository, CDC STACKS retains documents in their original published format to ensure public access to scientific information.
You May Also Like
COLLECTION
CDC Public Access