
i
U.S. census unit population exposures to ambient air pollutants
-
Jan 12 2012
Source: Int J Health Geogr. 2012; 11:3.
 [PDF-4.63 MB]
Details:
-
Alternative Title:Int J Health Geogr
-
Personal Author:
-
Description:Background
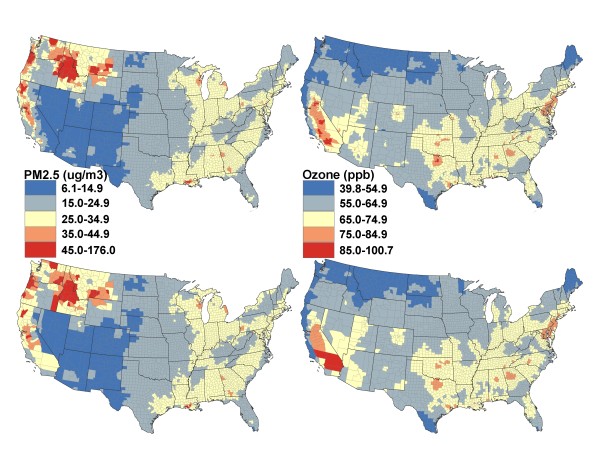
Progress has been made recently in estimating ambient PM2.5 (particulate matter with aerodynamic diameter < 2.5 μm) and ozone concentrations using various data sources and advanced modeling techniques, which resulted in gridded surfaces. However, epidemiologic and health impact studies often require population exposures to ambient air pollutants to be presented at an appropriate census geographic unit (CGU), where health data are usually available to maintain confidentiality of individual health data. We aim to generate estimates of population exposures to ambient PM2.5 and ozone for U.S. CGUs.
Methods
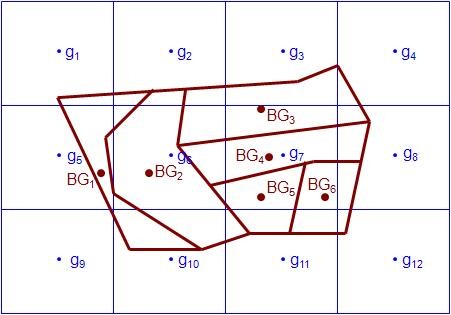
We converted 2001-2006 gridded data, generated by the U.S. Environmental Protection Agency (EPA) for CDC's (Centers for Disease Control and Prevention) Environmental Public Health Tracking Network (EPHTN), to census block group (BG) based on spatial proximities between BG and its four nearest grids. We used a bottom-up (fine to coarse) strategy to generate population exposure estimates for larger CGUs by aggregating BG estimates weighted by population distribution.
Results
The BG daily estimates were comparable to monitoring data. On average, the estimates deviated by 2 μg/m3 (for PM2.5) and 3 ppb (for ozone) from their corresponding observed values. Population exposures to ambient PM2.5 and ozone varied greatly across the U.S. In 2006, estimates for daily potential population exposure to ambient PM2.5 in west coast states, the northwest and a few areas in the east and estimates for daily potential population exposure to ambient ozone in most of California and a few areas in the east/southeast exceeded the National Ambient Air Quality Standards (NAAQS) for at least 7 days.
Conclusions
These estimates may be useful in assessing health impacts through linkage studies and in communicating with the public and policy makers for potential intervention.
-
Subjects:
-
Source:
-
Document Type:
-
Place as Subject:
-
Collection(s):
-
Main Document Checksum:
-
Download URL:
-
File Type:
Supporting Files
-
txt 
gif 
jpeg 
gif 
jpeg 
gif 
jpeg 
doc
txt

More +
You May Also Like
 [PDF - 386.41 KB]

 Email
CDC-INFO
Email
CDC-INFO


