Particle size distributions by transmission electron microscopy: an interlaboratory comparison case study
Supporting Files

-
11 2013
-
File Language:
English
Details
-
Alternative Title:Metrologia
-
Personal Author:
-
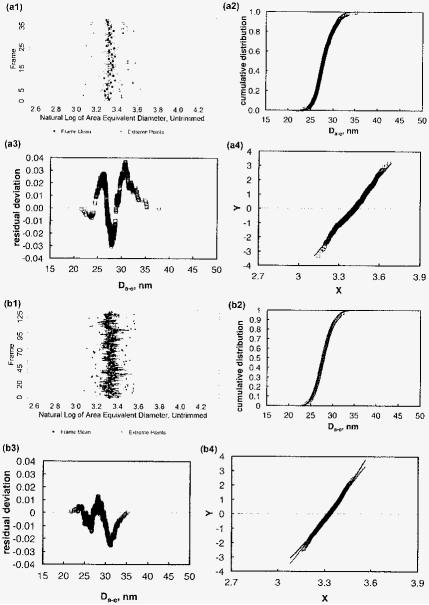
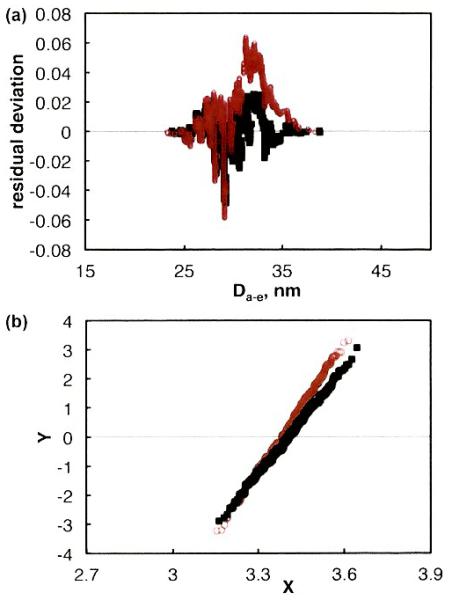
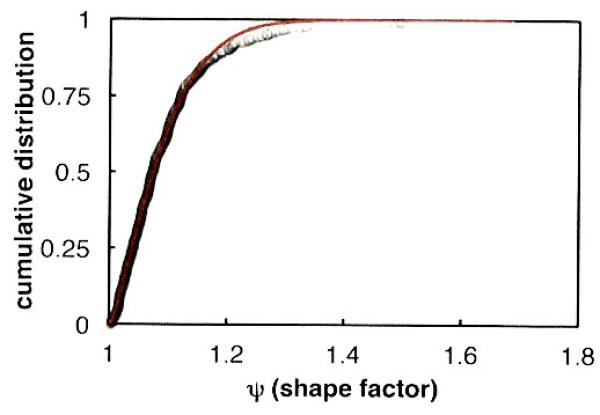
Description:This paper reports an interlaboratory comparison that evaluated a protocol for measuring and analysing the particle size distribution of discrete, metallic, spheroidal nanoparticles using transmission electron microscopy (TEM). The study was focused on automated image capture and automated particle analysis. NIST RM8012 gold nanoparticles (30 nm nominal diameter) were measured for area-equivalent diameter distributions by eight laboratories. Statistical analysis was used to (1) assess the data quality without using size distribution reference models, (2) determine reference model parameters for different size distribution reference models and non-linear regression fitting methods and (3) assess the measurement uncertainty of a size distribution parameter by using its coefficient of variation. The interlaboratory area-equivalent diameter mean, 27.6 nm ± 2.4 nm (computed based on a normal distribution), was quite similar to the area-equivalent diameter, 27.6 nm, assigned to NIST RM8012. The lognormal reference model was the preferred choice for these particle size distributions as, for all laboratories, its parameters had lower relative standard errors (RSEs) than the other size distribution reference models tested (normal, Weibull and Rosin-Rammler-Bennett). The RSEs for the fitted standard deviations were two orders of magnitude higher than those for the fitted means, suggesting that most of the parameter estimate errors were associated with estimating the breadth of the distributions. The coefficients of variation for the interlaboratory statistics also confirmed the lognormal reference model as the preferred choice. From quasi-linear plots, the typical range for good fits between the model and cumulative number-based distributions was 1.9 fitted standard deviations less than the mean to 2.3 fitted standard deviations above the mean. Automated image capture, automated particle analysis and statistical evaluation of the data and fitting coefficients provide a framework for assessing nanoparticle size distributions using TEM for image acquisition.
-
Source:Metrologia. 50(6):663-678
-
Pubmed ID:26361398
-
Pubmed Central ID:PMC4562322
-
Document Type:
-
Funding:
-
Volume:50
-
Issue:6
-
Collection(s):
-
Main Document Checksum:urn:sha-512:a0dd7a4975b8a850e0260ef3635cbe5863af2cd661a440dbf4996f6b4ecea7437970d3311ef83bbd60ce584738f02fe7a224e253be8cb0c31ebdb5c532ed375b
-
Download URL:
-
File Type:
 [PDF
- 940.41 KB
]
[PDF
- 940.41 KB
]
Supporting Files

File Language:
English
ON THIS PAGE

CDC STACKS serves as an archival repository of CDC-published products including
scientific findings,
journal articles, guidelines, recommendations, or other public health information authored or
co-authored by CDC or funded partners.
As a repository, CDC STACKS retains documents in their original published format to ensure public access to scientific information.
As a repository, CDC STACKS retains documents in their original published format to ensure public access to scientific information.