U.S. Trends in Computed Tomography Use and Diagnoses in Emergency Department Visits by Patients With Symptoms Suggestive of Pulmonary Embolism, 2001–2009
Supporting Files

-
Oct 2013
-
File Language:
English
Details
-
Alternative Title:Acad Emerg Med
-
Personal Author:
-
Description:Objectives
Using computed tomography (CT) to evaluate patients with chest symptoms is common in emergency departments (EDs). This article describes recent trends of CT use in U.S. EDs for patients presenting with symptoms common to acute pulmonary embolism (PE).
Methods
The 2001–2009 National Hospital Ambulatory Medical Care Survey (NHAMCS), a nationally representative survey of U.S. ED encounters, was used for data collection. Patients with at least one of three complaints (chest pain, dyspnea, or hemoptysis) were categorized into the chest symptom study (CSS) group. The yearly increases in CT use for the complaints were tabulated first, then linear regression analysis was used to calculate average rates of increases in CT use between 2001 and 2007, the years where CT use increased, for the overall population and among specific subgroups. The ratios of the number of visits when CT was ordered and there was a target diagnosis relative to the total number of visits with CT in the CSS group (diagnosis/CT ratio) were calculated for PE and pneumonia.
Results
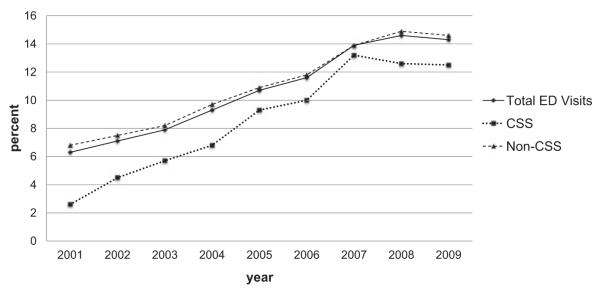
Annual CT rates for the CSS group increased from 2.6% in 2001 to 13.2% in 2007, subsequently leveling off at approximately 12.5% in 2008 and 2009. The average growth rate of CT use for the CSS group was 28.1% (95% confidence interval [CI] = 20.9% to 35.7%) per year between 2001 and 2007. Testing rates for all subgroups increased. The lowest growth rate was among Hispanic patients, whose CT rates grew 14.2% (95% CI = 5.7% to 23.5%) per year. The highest growth rate was in nonurban hospitals, at 43.1% (95% CI = 15.2% to 77.8%) per year. Patients triaged as nonurgent received the fewest CTs, compared to those who should be seen in 2 hours or less. With regard to sources of payment, the self-pay subgroup experienced the highest rate of increase at 35.1% (95% CI = 18.6% to 53.9%). The PE diagnosis/CT ratio from 2002 to 2009 was 2.7% for the CSS group. The pneumonia diagnosis/CT ratio grew from 5.8% in 2002 to 2005 to 7.8% in 2006 to 2009.
Conclusions
Computed tomography use in ED visits by patients with chest symptoms increased dramatically from 2001 to 2007 and seems to have leveled off in subsequent years. The low PE diagnosis-to-CT ratio suggests that EDs may need to promote evidence-based use of CT.
-
Subjects:
-
Source:Acad Emerg Med. 2013; 20(10):1033-1040.
-
Pubmed ID:24127707
-
Pubmed Central ID:PMC4453868
-
Document Type:
-
Funding:
-
Place as Subject:
-
Volume:20
-
Issue:10
-
Collection(s):
-
Main Document Checksum:urn:sha256:3002d9ce8d96a90babb0174a12d9acab2e69710f9c6015b66738b6986f7cbb78
-
Download URL:
-
File Type:
 [PDF
- 295.61 KB
]
[PDF
- 295.61 KB
]
Supporting Files

File Language:
English
ON THIS PAGE

CDC STACKS serves as an archival repository of CDC-published products including
scientific findings,
journal articles, guidelines, recommendations, or other public health information authored or
co-authored by CDC or funded partners.
As a repository, CDC STACKS retains documents in their original published format to ensure public access to scientific information.
As a repository, CDC STACKS retains documents in their original published format to ensure public access to scientific information.
You May Also Like
COLLECTION
CDC Public Access