Modeling the probability distribution of positional errors incurred by residential address geocoding
Supporting Files

-
Jan 10 2007
-
Details
-
Alternative Title:Int J Health Geogr
-
Personal Author:
-
Description:Background
The assignment of a point-level geocode to subjects' residences is an important data assimilation component of many geographic public health studies. Often, these assignments are made by a method known as automated geocoding, which attempts to match each subject's address to an address-ranged street segment georeferenced within a streetline database and then interpolate the position of the address along that segment. Unfortunately, this process results in positional errors. Our study sought to model the probability distribution of positional errors associated with automated geocoding and E911 geocoding.
Results
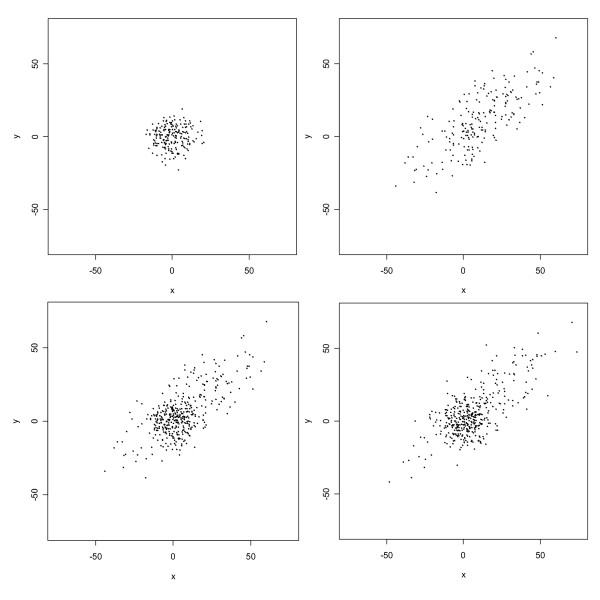
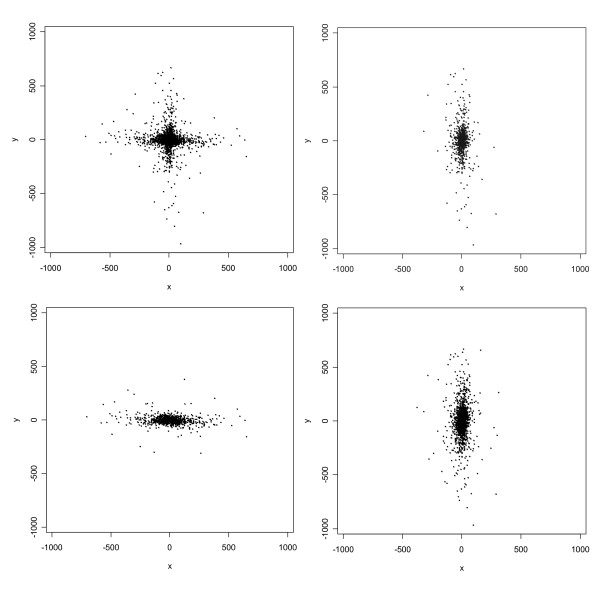
Positional errors were determined for 1423 rural addresses in Carroll County, Iowa as the vector difference between each 100%-matched automated geocode and its true location as determined by orthophoto and parcel information. Errors were also determined for 1449 60%-matched geocodes and 2354 E911 geocodes. Huge (> 15 km) outliers occurred among the 60%-matched geocoding errors; outliers occurred for the other two types of geocoding errors also but were much smaller. E911 geocoding was more accurate (median error length = 44 m) than 100%-matched automated geocoding (median error length = 168 m). The empirical distributions of positional errors associated with 100%-matched automated geocoding and E911 geocoding exhibited a distinctive Greek-cross shape and had many other interesting features that were not capable of being fitted adequately by a single bivariate normal or t distribution. However, mixtures of t distributions with two or three components fit the errors very well.
Conclusion
Mixtures of bivariate t distributions with few components appear to be flexible enough to fit many positional error datasets associated with geocoding, yet parsimonious enough to be feasible for nascent applications of measurement-error methodology to spatial epidemiology.
-
Subjects:
-
Source:Int J Health Geogr. 2007; 6:1.
-
Document Type:
-
Funding:
-
Place as Subject:
-
Volume:6
-
Collection(s):
-
Main Document Checksum:urn:sha256:04ad0fcc6af6915b9686564069ae22e91df2bb79b6157af08fef03f777b0ba08
-
Download URL:
-
File Type:
 [PDF
- 1.38 MB
]
[PDF
- 1.38 MB
]
Supporting Files

ON THIS PAGE

CDC STACKS serves as an archival repository of CDC-published products including
scientific findings,
journal articles, guidelines, recommendations, or other public health information authored or
co-authored by CDC or funded partners.
As a repository, CDC STACKS retains documents in their original published format to ensure public access to scientific information.
As a repository, CDC STACKS retains documents in their original published format to ensure public access to scientific information.
You May Also Like
COLLECTION
CDC Public Access