Evaluation of the Placement of Mobile Fruit and Vegetable Vendors to Alleviate Food Deserts in New York City
Supporting Files
Public Domain

-
Sep 11 2014
-
File Language:
English
Details
-
Journal Article:Preventing Chronic Disease (PCD)
-
Personal Author:
-
Description:Introduction
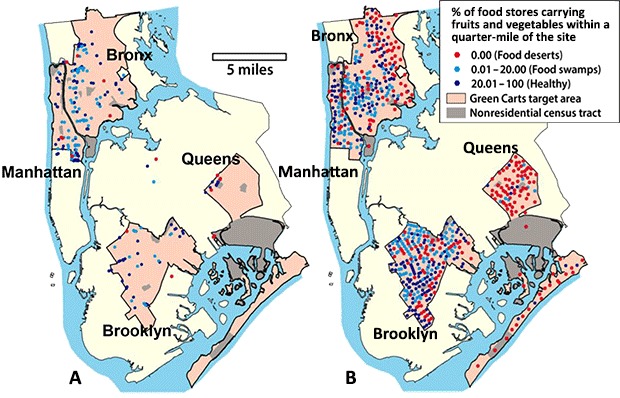
In 2008, the New York City (NYC) health department licensed special mobile produce vendors (Green Carts) to increase access to fruits and vegetables in neighborhoods with the lowest reported fruit and vegetable consumption and the highest obesity rates. Because economic incentives may push vendors to locate in more trafficked, less produce-deprived areas, we examined characteristics of areas with and without Green Carts to explore whether Carts are positioned to reach the intended populations.
Methods
Using ArcGIS software, we mapped known NYC Green Cart locations noted through 2013 and generated a list of potential (candidate) sites where Carts could have located. We compared the food environment (via categorizing “healthy” or “unhealthy” food stores using federal classification codes corroborated by online storefront images) and other factors that might explain Cart location (eg, demographic, business, neighborhood characteristics) near actual and candidate sites descriptively and inferentially.
Results
Seven percent of Green Carts (n = 265) were in food deserts (no healthy stores within one-quarter mile) compared with 36% of candidate sites (n = 644, P < .001). Most Carts (78%) were near 2 or more healthy stores. Green Carts had nearly 60 times the odds of locating near subway stops (P < .001), were closer to large employers (odds ratio [OR], 6.4; P < .001), other food stores (OR, 14.1; P < .001), and in more populous tracts (OR, 2.9, P <.01) compared with candidate sites.
Conclusion
Green Carts were rarely in food deserts and usually had multiple healthy stores nearby, suggesting that Carts may not be serving the neediest neighborhoods. Exploration of Carts’ benefits in non–food desert areas is needed, but incentivizing vendors to locate in still-deprived places may increase program impact.
-
Subjects:
-
Source:Prev Chronic Dis. 11.
-
DOI:
-
ISSN:1545-1151
-
Document Type:
-
Place as Subject:
-
Volume:11
-
Collection(s):
-
Main Document Checksum:urn:sha-512:cb0d197cdb8cdb118ae0cb84665f877e0cb85835f595de2a4c93b6c349de9f10bc12d5aed48bd3d307375e4f2cdd3e6320be7cdb251704413876f8b925e94e4a
-
Download URL:
-
File Type:
 [PDF
- 392.59 KB
]
[PDF
- 392.59 KB
]
Supporting Files

File Language:
English
ON THIS PAGE

CDC STACKS serves as an archival repository of CDC-published products including
scientific findings,
journal articles, guidelines, recommendations, or other public health information authored or
co-authored by CDC or funded partners.
As a repository, CDC STACKS retains documents in their original published format to ensure public access to scientific information.
As a repository, CDC STACKS retains documents in their original published format to ensure public access to scientific information.
You May Also Like
COLLECTION
Preventing Chronic Disease