Estimates of the reproduction number for seasonal, pandemic, and zoonotic influenza: a systematic review of the literature
Supporting Files

-
Sep 04 2014
-
File Language:
English
Details
-
Alternative Title:BMC Infect Dis
-
Personal Author:
-
Description:Background
The potential impact of an influenza pandemic can be assessed by calculating a set of transmissibility parameters, the most important being the reproduction number (R), which is defined as the average number of secondary cases generated per typical infectious case.
Methods
We conducted a systematic review to summarize published estimates of R for pandemic or seasonal influenza and for novel influenza viruses (e.g. H5N1). We retained and summarized papers that estimated R for pandemic or seasonal influenza or for human infections with novel influenza viruses.
Results
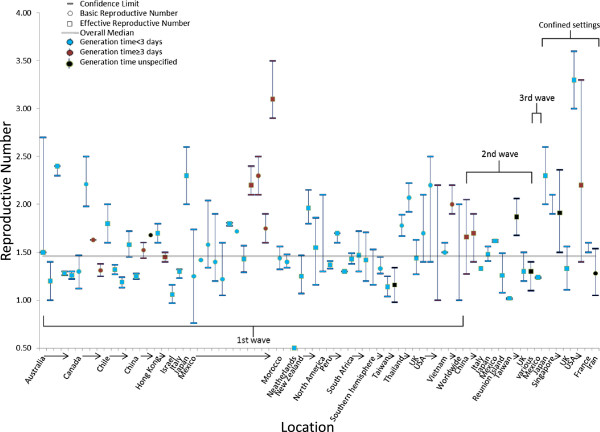
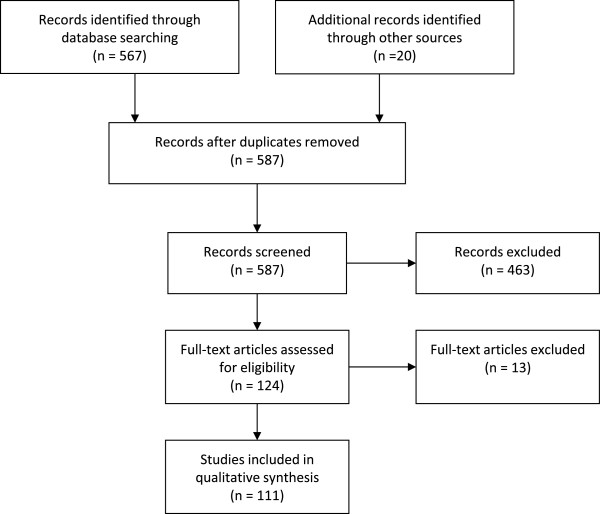
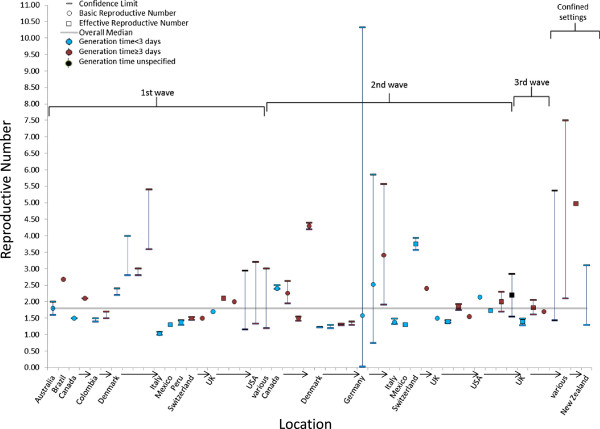
The search yielded 567 papers. Ninety-one papers were retained, and an additional twenty papers were identified from the references of the retained papers. Twenty-four studies reported 51 R values for the 1918 pandemic. The median R value for 1918 was 1.80 (interquartile range [IQR]: 1.47–2.27). Six studies reported seven 1957 pandemic R values. The median R value for 1957 was 1.65 (IQR: 1.53–1.70). Four studies reported seven 1968 pandemic R values. The median R value for 1968 was 1.80 (IQR: 1.56–1.85). Fifty-seven studies reported 78 2009 pandemic R values. The median R value for 2009 was 1.46 (IQR: 1.30–1.70) and was similar across the two waves of illness: 1.46 for the first wave and 1.48 for the second wave. Twenty-four studies reported 47 seasonal epidemic R values. The median R value for seasonal influenza was 1.28 (IQR: 1.19–1.37). Four studies reported six novel influenza R values. Four out of six R values were <1.
Conclusions
These R values represent the difference between epidemics that are controllable and cause moderate illness and those causing a significant number of illnesses and requiring intensive mitigation strategies to control. Continued monitoring of R during seasonal and novel influenza outbreaks is needed to document its variation before the next pandemic.
Electronic supplementary material
The online version of this article (doi:10.1186/1471-2334-14-480) contains supplementary material, which is available to authorized users.
-
Subjects:
-
Source:BMC Infect Dis. 14.
-
Document Type:
-
Funding:
-
Volume:14
-
Collection(s):
-
Main Document Checksum:urn:sha256:aa373c6972df7b802e83c76c7b6ad8795b85b5f8d91cfc881a75463ae0086982
-
Download URL:
-
File Type:
 [PDF
- 1.45 MB
]
[PDF
- 1.45 MB
]
Supporting Files

File Language:
English
ON THIS PAGE

CDC STACKS serves as an archival repository of CDC-published products including
scientific findings,
journal articles, guidelines, recommendations, or other public health information authored or
co-authored by CDC or funded partners.
As a repository, CDC STACKS retains documents in their original published format to ensure public access to scientific information.
As a repository, CDC STACKS retains documents in their original published format to ensure public access to scientific information.
You May Also Like
COLLECTION
CDC Public Access