Monitoring Progress in Population Health: Trends in Premature Death Rates
Supporting Files
Public Domain

-
Dec 26 2013
File Language:
English
Details
-
Journal Article:Preventing Chronic Disease (PCD)
-
Personal Author:
-
Description:Introduction
Trends in population health outcomes can be monitored to evaluate the performance of population health systems at the national, state, and local levels. The objective of this study was to compare and contrast 4 measures for assessing progress in population health improvement by using age-adjusted premature death rates as a summary measure of the overall health outcomes in the United States and in all 50 states.
Methods
To evaluate the performance of statewide population health systems during the past 20 years, we used 4 measures of age-adjusted premature (<75 years of age) death rates: current rates (2009), baseline trends (1990s), follow-up trends (2000s), and changes in trends from baseline to the follow-up periods (ie, “bending the curve”).
Results
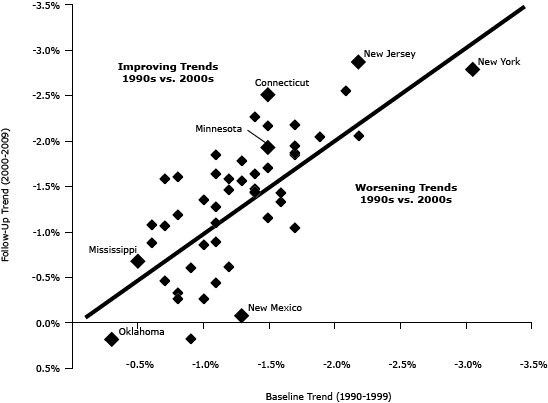
Current premature death rates varied by approximately twofold, with the lowest rate in Minnesota (268 deaths per 100,000) and the highest rate in Mississippi (482 deaths per 100,000). Rates improved the most in New York during the baseline period (−3.05% per year) and in New Jersey during the follow-up period (−2.87% per year), whereas Oklahoma ranked last in trends during both periods (−0.30%/y, baseline; +0.18%/y, follow-up). Trends improved the most in Connecticut, bending the curve downward by −1.03%; trends worsened the most in New Mexico, bending the curve upward by 1.21%.
Discussion
Current premature death rates, recent trends, and changes in trends vary by state in the United States. Policy makers can use these measures to evaluate the long-term population health impact of broad health care, behavioral, social, and economic investments in population health.
-
Subjects:
-
Source:Prev Chronic Dis. 10.
-
ISSN:1545-1151
-
Document Type:
-
Name as Subject:
-
Place as Subject:
-
Volume:10
-
Collection(s):
-
Main Document Checksum:urn:sha-512:0aca507234bd67e41c8216dcfc0422fb527554edfd15e4867b0df89706907c4541a8840cbdeca498c7e0b7c35b982c1043192b47817e3b7b59be3517d545b4f4
-
Download URL:
-
File Type:
 [PDF
- 537.28 KB
]
[PDF
- 537.28 KB
]
Supporting Files

File Language:
English
ON THIS PAGE

CDC STACKS serves as an archival repository of CDC-published products including
scientific findings,
journal articles, guidelines, recommendations, or other public health information authored or
co-authored by CDC or funded partners.
As a repository, CDC STACKS retains documents in their original published format to ensure public access to scientific information.
As a repository, CDC STACKS retains documents in their original published format to ensure public access to scientific information.
You May Also Like
COLLECTION
Preventing Chronic Disease