i
Childhood Obesity — What We Can Learn From Existing Data on Societal Trends, Part 2
-
Mar 15 2005
-
Source: Prev Chronic Dis. 2005; 2(2).
 [PDF-316.77 KB]
Details:
-
Alternative Title:Prev Chronic Dis
-
Personal Author:
-
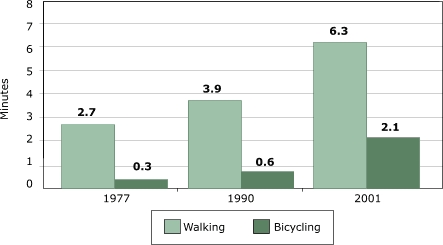
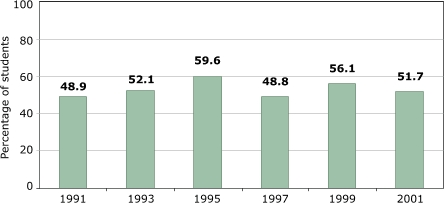
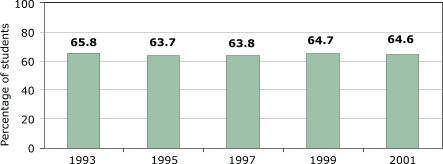
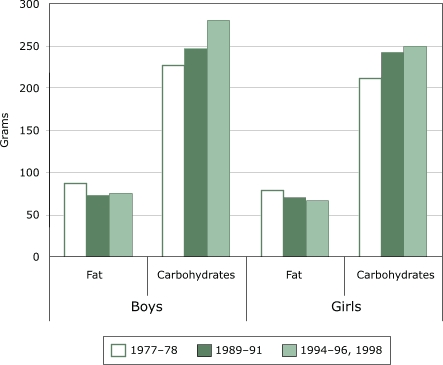
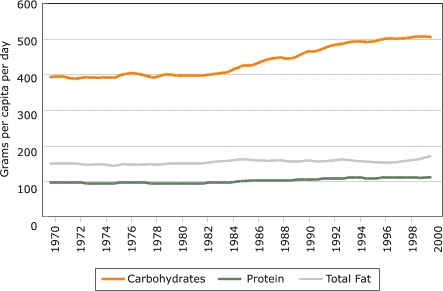
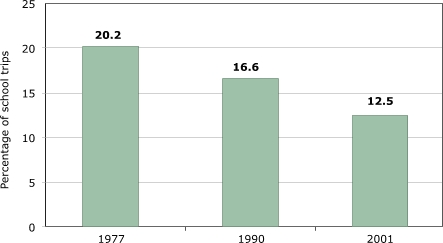
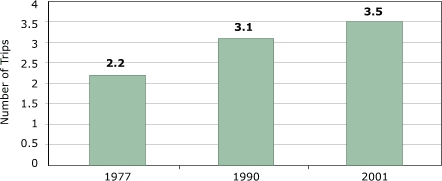
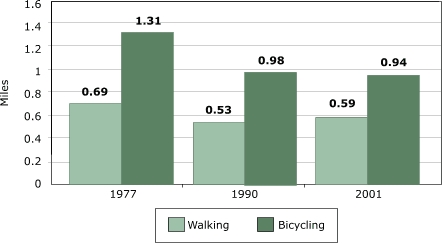
Description:The number of overweight and obese youth has increased in recent decades, yet few data assess how the lives of children have changed during the "obesity epidemic." Part 1 of this two-part study discussed trends in time use, studying at home, and media use. Part 2 focuses on transportation, physical education, and diet. Walking or biking for transportation can expend a large amount of energy, but active transportation is not a major source of physical activity for youth, averaging eight minutes a day in 2001, with little change over the past few decades. For adolescents, there was no clear trend in physical education during the past decade, but there are no data for after-school and day-care programs, which have become more important as children spend more time away from home. For younger children, time spent in organized sports and outdoor activities increased by 73 minutes per week between 1981 and 1997. Eating as a primary activity declined, suggesting a shift toward snacking or eating as a secondary activity. Statistically significant trends exist for carbohydrate intake, especially for chips/crackers/popcorn/pretzels (intake tripled from the mid-1970s to the mid-1990s) and soft drinks (intake doubled during the same period). Price and income data suggest possible economic reasons for these changes. The percentage of disposable income spent on food has declined continuously, and almost all of the decline has been represented by food consumed at home, yet today's disposable income buys more calories than it has in the past. Relative prices have encouraged shifts across food types. From a baseline of 100 during 1982-84, the price index for fresh fruit and vegetables increased to 258 by 2002 (far exceeding general inflation), whereas the price index for soft drinks increased only to 126 by 2002 (below general inflation).
-
Subjects:
-
Source:
-
Document Type:
-
Collection(s):
-
Main Document Checksum:
-
Download URL:
-
File Type:
Supporting Files
-

gif
jpeg
gif
jpeg
gif
jpeg
gif
jpeg
gif
jpeg 
txt
gif
jpeg
gif
jpeg
txt
gif
jpeg
gif
jpeg
gif
jpeg

