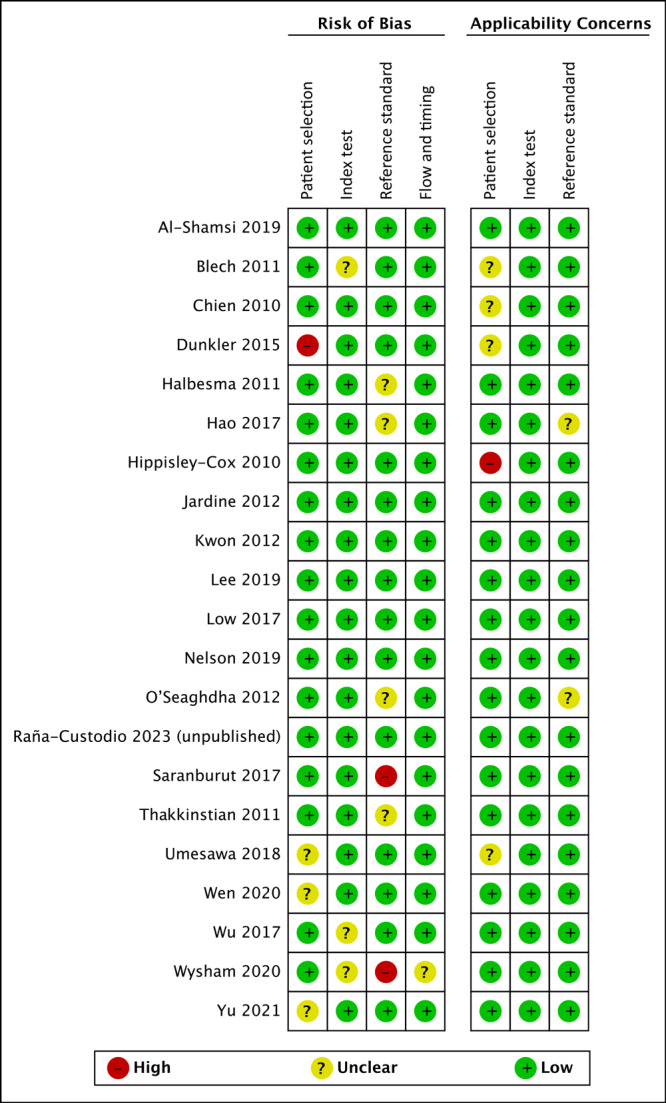
Risk Prediction Score for Chronic Kidney Disease in Healthy Adults and Adults With Type 2 Diabetes: Systematic Review
Supporting Files
Public Domain

-
4 20 2023
File Language:
English
Details
-
Journal Article:Preventing Chronic Disease (PCD)
-
Personal Author:
-
Description:Introduction
Chronic kidney disease (CKD) is an important public health problem. In 2017, the global prevalence was estimated at 9.1%. Appropriate tools to predict the risk of developing CKD are necessary to prevent its progression. Type 2 diabetes is a leading cause of CKD; screening the population living with the disease is a cost-effective solution to prevent CKD. The aim of our study was to identify the existing prediction scores and their diagnostic accuracy for detecting CKD in apparently healthy populations and populations with type 2 diabetes.
Methods
We conducted an electronic search in databases, including Medline/PubMed, Embase, Health Evidence, and others. For the inclusion criteria we considered studies with a risk predictive score in healthy populations and populations with type 2 diabetes. We extracted information about the models, variables, and diagnostic accuracy, such as area under the receiver operating characteristic curve (AUC), C statistic, or sensitivity and specificity.
Results
We screened 2,359 records and included 13 studies for healthy population, 7 studies for patients with type 2 diabetes, and 1 for both populations. We identified 12 models for patients with type 2 diabetes; the range of C statistic was from 0.56 to 0.81, and the range of AUC was from 0.71 to 0.83. For healthy populations, we identified 36 models with the range of C statistics from 0.65 to 0.91, and the range of AUC from 0.63 to 0.91.
Conclusion
This review identified models with good discriminatory performance and methodologic quality, but they need more validation in populations other than those studied. This review did not identify risk models with variables comparable between them to enable conducting a meta-analysis.
-
Subjects:
-
Source:Prev Chronic Dis. 2023; 20
-
DOI:
-
ISSN:1545-1151
-
Pubmed ID:37079751
-
Pubmed Central ID:PMC10159345
-
Document Type:
-
Genre:
-
Volume:20
-
Collection(s):
-
Main Document Checksum:urn:sha-512:c159ba240afdb802ba24e711e2180380a7718c43d8793f97e4343ec84c09a25ed6649196394920e9ff6ddfaf2bcd2b8798769501e752633e75213125d22bdb8d
-
Download URL:
-
File Type:
 [PDF
- 749.99 KB
]
[PDF
- 749.99 KB
]
Supporting Files

File Language:
English
ON THIS PAGE

CDC STACKS serves as an archival repository of CDC-published products including
scientific findings,
journal articles, guidelines, recommendations, or other public health information authored or
co-authored by CDC or funded partners.
As a repository, CDC STACKS retains documents in their original published format to ensure public access to scientific information.
As a repository, CDC STACKS retains documents in their original published format to ensure public access to scientific information.
You May Also Like
COLLECTION
Preventing Chronic Disease