Trends in Over-the-Counter Nicotine Replacement Therapy Sales, U.S., 2017–2020
Supporting Files

-
1 20 2023
-
File Language:
English
Details
-
Alternative Title:Am J Prev Med
-
Personal Author:
-
Description:Introduction:
Few studies have examined trends in over-the-counter U.S. Food and Drug Administration–approved nicotine replacement therapy sales data and consumer preferences for nicotine replacement therapy attributes (e.g., flavor). Examination of consumer preferences may inform both public health smoking cessation programs as well as subsequent research on consumer preferences for potentially reduced-risk tobacco products U.S. Food and Drug Administration may authorize.
Methods:
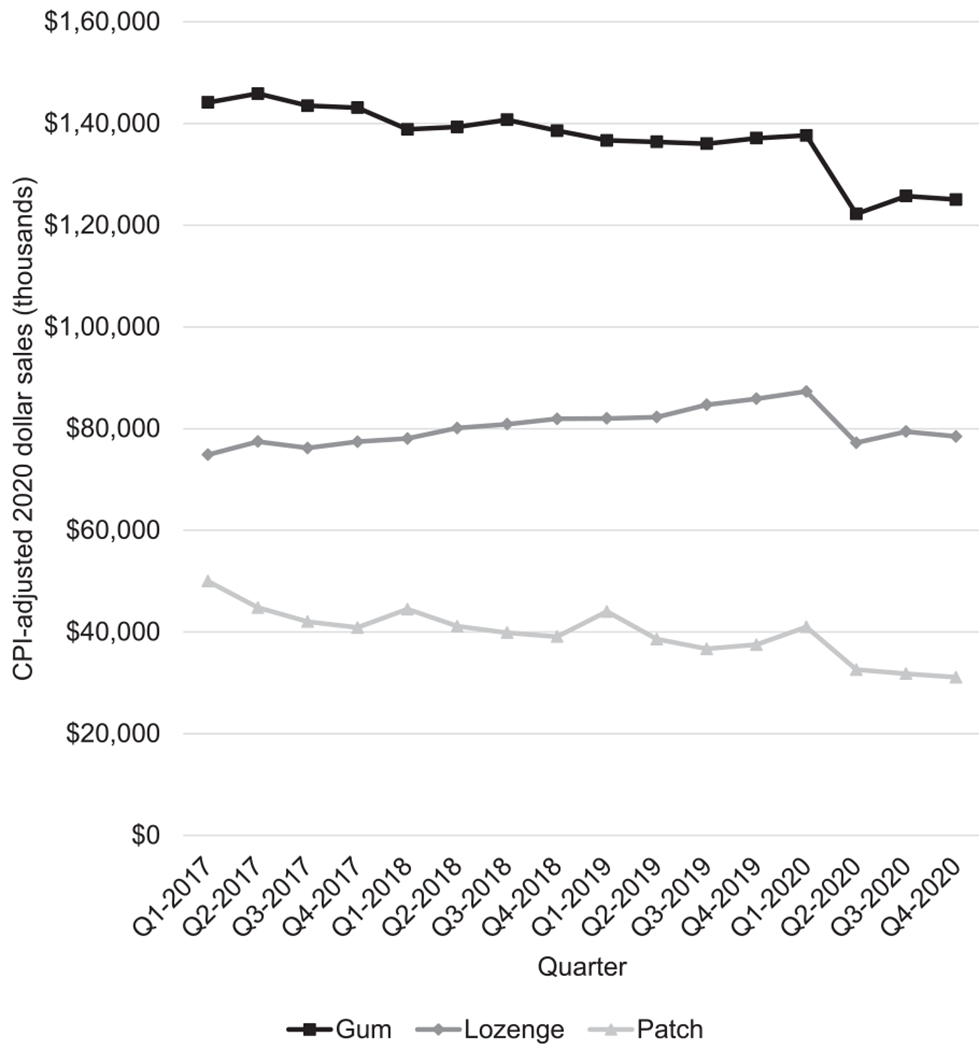
NielsenIQ Retail Measurement Service data were used to examine national trends in over-the-counter nicotine replacement therapy dollar sales from 2017 to 2020 and dollar sales by retail channel and product attributes for the most recent year available at the time of analysis (2020).
Results:
Over-the-counter nicotine replacement therapy sales totaled about $1 billion annually between 2017 and 2020. Across the 4-year period, sales of gum and patches decreased, whereas lozenge sales increased (p<0.05 for all). In 2020, gum accounted for 52.7% ($511 million), lozenges accounted for 33.3% ($322 million), and patches accounted for 14.1% ($137 million) of over-the-counter nicotine replacement therapy sales. Drug stores were the retail channel accounting for the largest percentage of total over-the-counter nicotine replacement therapy sales (42.9%). Three leading brands–private label or store brands (62.8%), Nicorette (30.7%,), and NicoDerm CQ (5.7%)–accounted for 99.2% of the total over-the-counter nicotine replacement therapy market. Mint was the most common flavor, representing 41.2% of total gum and 73.6% of total lozenge sales.
Conclusions:
This analysis of over-the-counter nicotine replacement therapy sales sheds light on consumer preferences for attributes that can inform efforts to facilitate smoking cessation and research on preferences related to potentially reduced-risk tobacco products.
-
Subjects:
-
Source:Am J Prev Med.
-
Pubmed ID:36682916
-
Pubmed Central ID:PMC10121784
-
Document Type:
-
Funding:
-
Collection(s):
-
Main Document Checksum:urn:sha256:0b1ca51a659cf3e0803537fbf952ac1820b19b27974f5c78a13113d3eabe4584
-
Download URL:
-
File Type:
 [PDF
- 178.67 KB
]
[PDF
- 178.67 KB
]
Supporting Files

File Language:
English
ON THIS PAGE

CDC STACKS serves as an archival repository of CDC-published products including
scientific findings,
journal articles, guidelines, recommendations, or other public health information authored or
co-authored by CDC or funded partners.
As a repository, CDC STACKS retains documents in their original published format to ensure public access to scientific information.
As a repository, CDC STACKS retains documents in their original published format to ensure public access to scientific information.
You May Also Like
COLLECTION
CDC Public Access