Inequities in Physical Activity Environments and Leisure-Time Physical Activity in Rural Communities
Supporting Files
Public Domain

-
7 07 2022
-
File Language:
English
Details
-
Journal Article:Preventing Chronic Disease (PCD)
-
Personal Author:
-
Description:Introduction
Differential access to environments supportive of physical activity (PA) may help explain racial and socioeconomic disparities in leisure-time physical activity (LTPA) in rural communities.
Methods
We used baseline data from a mailed survey (N = 728) conducted in 2019 as part of an evaluation of The Two Georgias Initiative to examine the relationships among LTPA, sociodemographic characteristics, and perceived access to supportive PA environments (eg, areas around the home/neighborhood, indoor and outdoor exercise areas, town center connectivity) in 3 rural Georgia counties.
Results
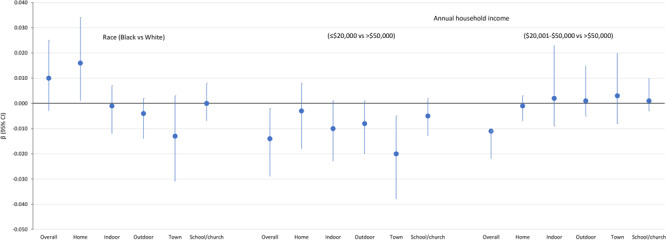
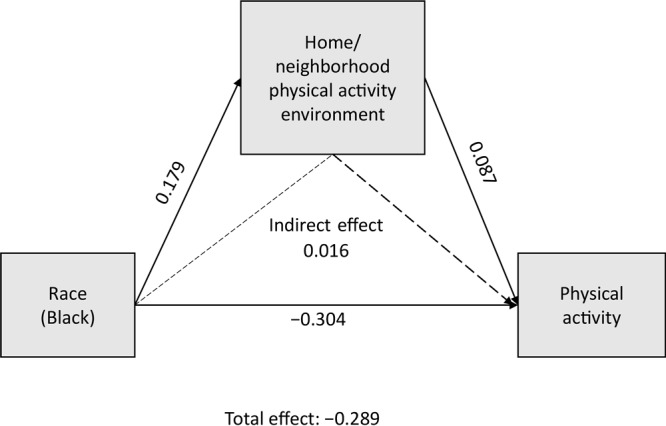
More than half of respondents (53.5%) engaged in LTPA in the previous month. Perceptions of PA environments were generally neutral to somewhat negative. In multivariable models, overall PA environment was associated with LTPA (OR, 1.58; 95% CI, 1.06–2.35), as was annual household income >$50,000 relative to ≤$20,000 (OR, 2.72; 95% CI, 1.53–4.83) and race, with Black respondents less likely to engage in LTPA than White respondents (OR, 0.49; 95% CI, 0.29–0.85). Of the 5 PA environment domains examined, town center connectivity was significantly associated with LTPA (OR, 1.68, 95% CI, 1.20–2.36). Both the overall PA score (β = −0.014; 95% CI, −0.029 to −0.002) and town center connectivity (β = −0.020; 95% CI, −0.038 to −0.005) partially mediated associations between annual household income and LTPA. Areas supportive of PA around the home/neighborhood partially mediated the association by race (β = 0.016; 95% CI, 0.001–0.034).
Conclusion
Findings lend support for investing in town centers and racially diverse neighborhoods to increase walkability and PA infrastructure as potential strategies to reduce inequities in LTPA.
-
Subjects:
-
Source:Prev Chronic Dis. 2022; 19
-
DOI:
-
ISSN:1545-1151
-
Pubmed ID:35797473
-
Pubmed Central ID:PMC9336193
-
Document Type:
-
Volume:19
-
Collection(s):
-
Main Document Checksum:urn:sha-512:49b89919abf12cc6814c5d38ccc3bb25c2dd4dd7cae39ed792ecb8488e009599821fa6bfe4e7bec969ba42403ff88c06a9d4be7ee187b423d02fe4ec05717398
-
Download URL:
-
File Type:
 [PDF
- 515.73 KB
]
[PDF
- 515.73 KB
]
Supporting Files

File Language:
English
ON THIS PAGE

CDC STACKS serves as an archival repository of CDC-published products including
scientific findings,
journal articles, guidelines, recommendations, or other public health information authored or
co-authored by CDC or funded partners.
As a repository, CDC STACKS retains documents in their original published format to ensure public access to scientific information.
As a repository, CDC STACKS retains documents in their original published format to ensure public access to scientific information.
You May Also Like
COLLECTION
Preventing Chronic Disease