The impact of emission and climate change on ozone in the United States under representative concentration pathways (RCPs)
Supporting Files

-
Sep 2013
-
File Language:
English
Details
-
Alternative Title:Atmos Chem Phys
-
Personal Author:
-
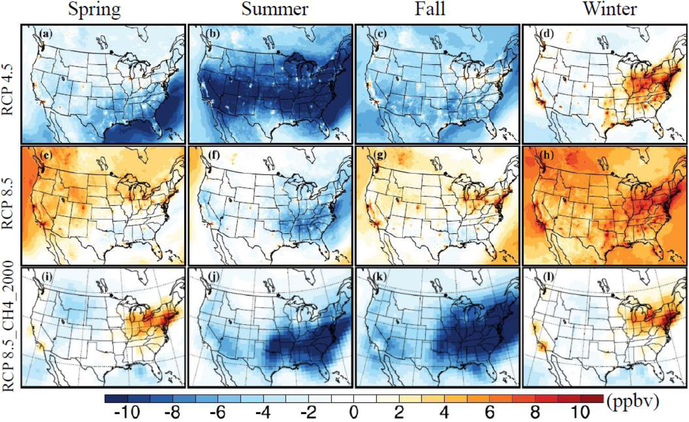
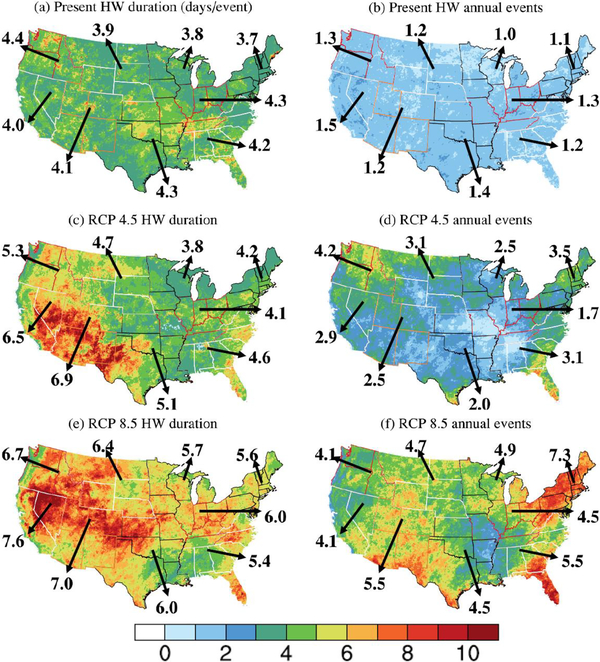
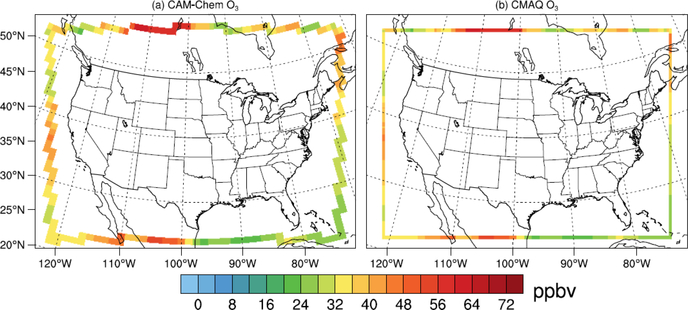
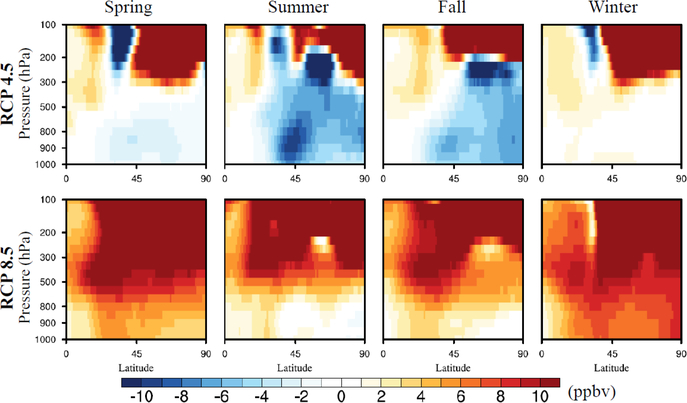
Description:Dynamical downscaling was applied in this study to link the global climate-chemistry model Community Atmosphere Model (CAM-Chem) with the regional models Weather Research and Forecasting (WRF) Model and Community Multi-scale Air Quality (CMAQ). Two representative concentration pathway (RCP) scenarios (RCP 4.5 and RCP 8.5) were used to evaluate the climate impact on ozone concentrations in the 2050s. From the CAM-Chem global simulation results, ozone concentrations in the lower to mid-troposphere (surface to ~300 hPa), from mid- to high latitudes in the Northern Hemisphere, decreases by the end of the 2050s (2057-2059) in RCP 4.5 compared to present (2001-2004), with the largest decrease of 4-10 ppbv occurring in the summer and the fall; and an increase as high as 10 ppbv in RCP 8.5 resulting from the increased methane emissions. From the regional model CMAQ simulation results, under the RCP 4.5 scenario (2057-2059), in the summer when photochemical reactions are the most active, the large ozone precursor emissions reduction leads to the greatest decrease of downscaled surface ozone concentrations compared to present (2001-2004), ranging from 6 to 10 ppbv. However, a few major cities show ozone increases of 3 to 7 ppbv due to weakened NO titration. Under the RCP 8.5 scenario, in winter, downscaled ozone concentrations increase across nearly the entire continental US in winter, ranging from 3 to 10 ppbv due to increased methane emissions. More intense heat waves are projected to occur by the end of the 2050s in RCP 8.5, leading to a 0.3 ppbv to 2.0 ppbv increase (statistically significant except in the Southeast) of the mean maximum daily 8 h daily average (MDA8) ozone in nine climate regions in the US. Moreover, the upper 95% limit of MDA8 increase reaches 0.4 ppbv to 1.5 ppbv in RCP 4.5 and 0.6 ppbv to 3.2 ppbv in RCP 8.5. The magnitude differences of increase between RCP 4.5 and 8.5 also reflect that the increase of methane emissions may favor or strengthen the effect of heat waves.
-
Subjects:
-
Source:Atmos Chem Phys. 13(18):9607-9621
-
Pubmed ID:34135946
-
Pubmed Central ID:PMC8205310
-
Document Type:
-
Funding:
-
Volume:13
-
Issue:18
-
Collection(s):
-
Main Document Checksum:urn:sha256:dab991fd532a4b8a8919bb75080b31900b90aecd1dda4f4102c0fd5542ff688d
-
Download URL:
-
File Type:
 [PDF
- 1.94 MB
]
[PDF
- 1.94 MB
]
Supporting Files

File Language:
English
ON THIS PAGE

CDC STACKS serves as an archival repository of CDC-published products including
scientific findings,
journal articles, guidelines, recommendations, or other public health information authored or
co-authored by CDC or funded partners.
As a repository, CDC STACKS retains documents in their original published format to ensure public access to scientific information.
As a repository, CDC STACKS retains documents in their original published format to ensure public access to scientific information.
You May Also Like
COLLECTION
CDC Public Access