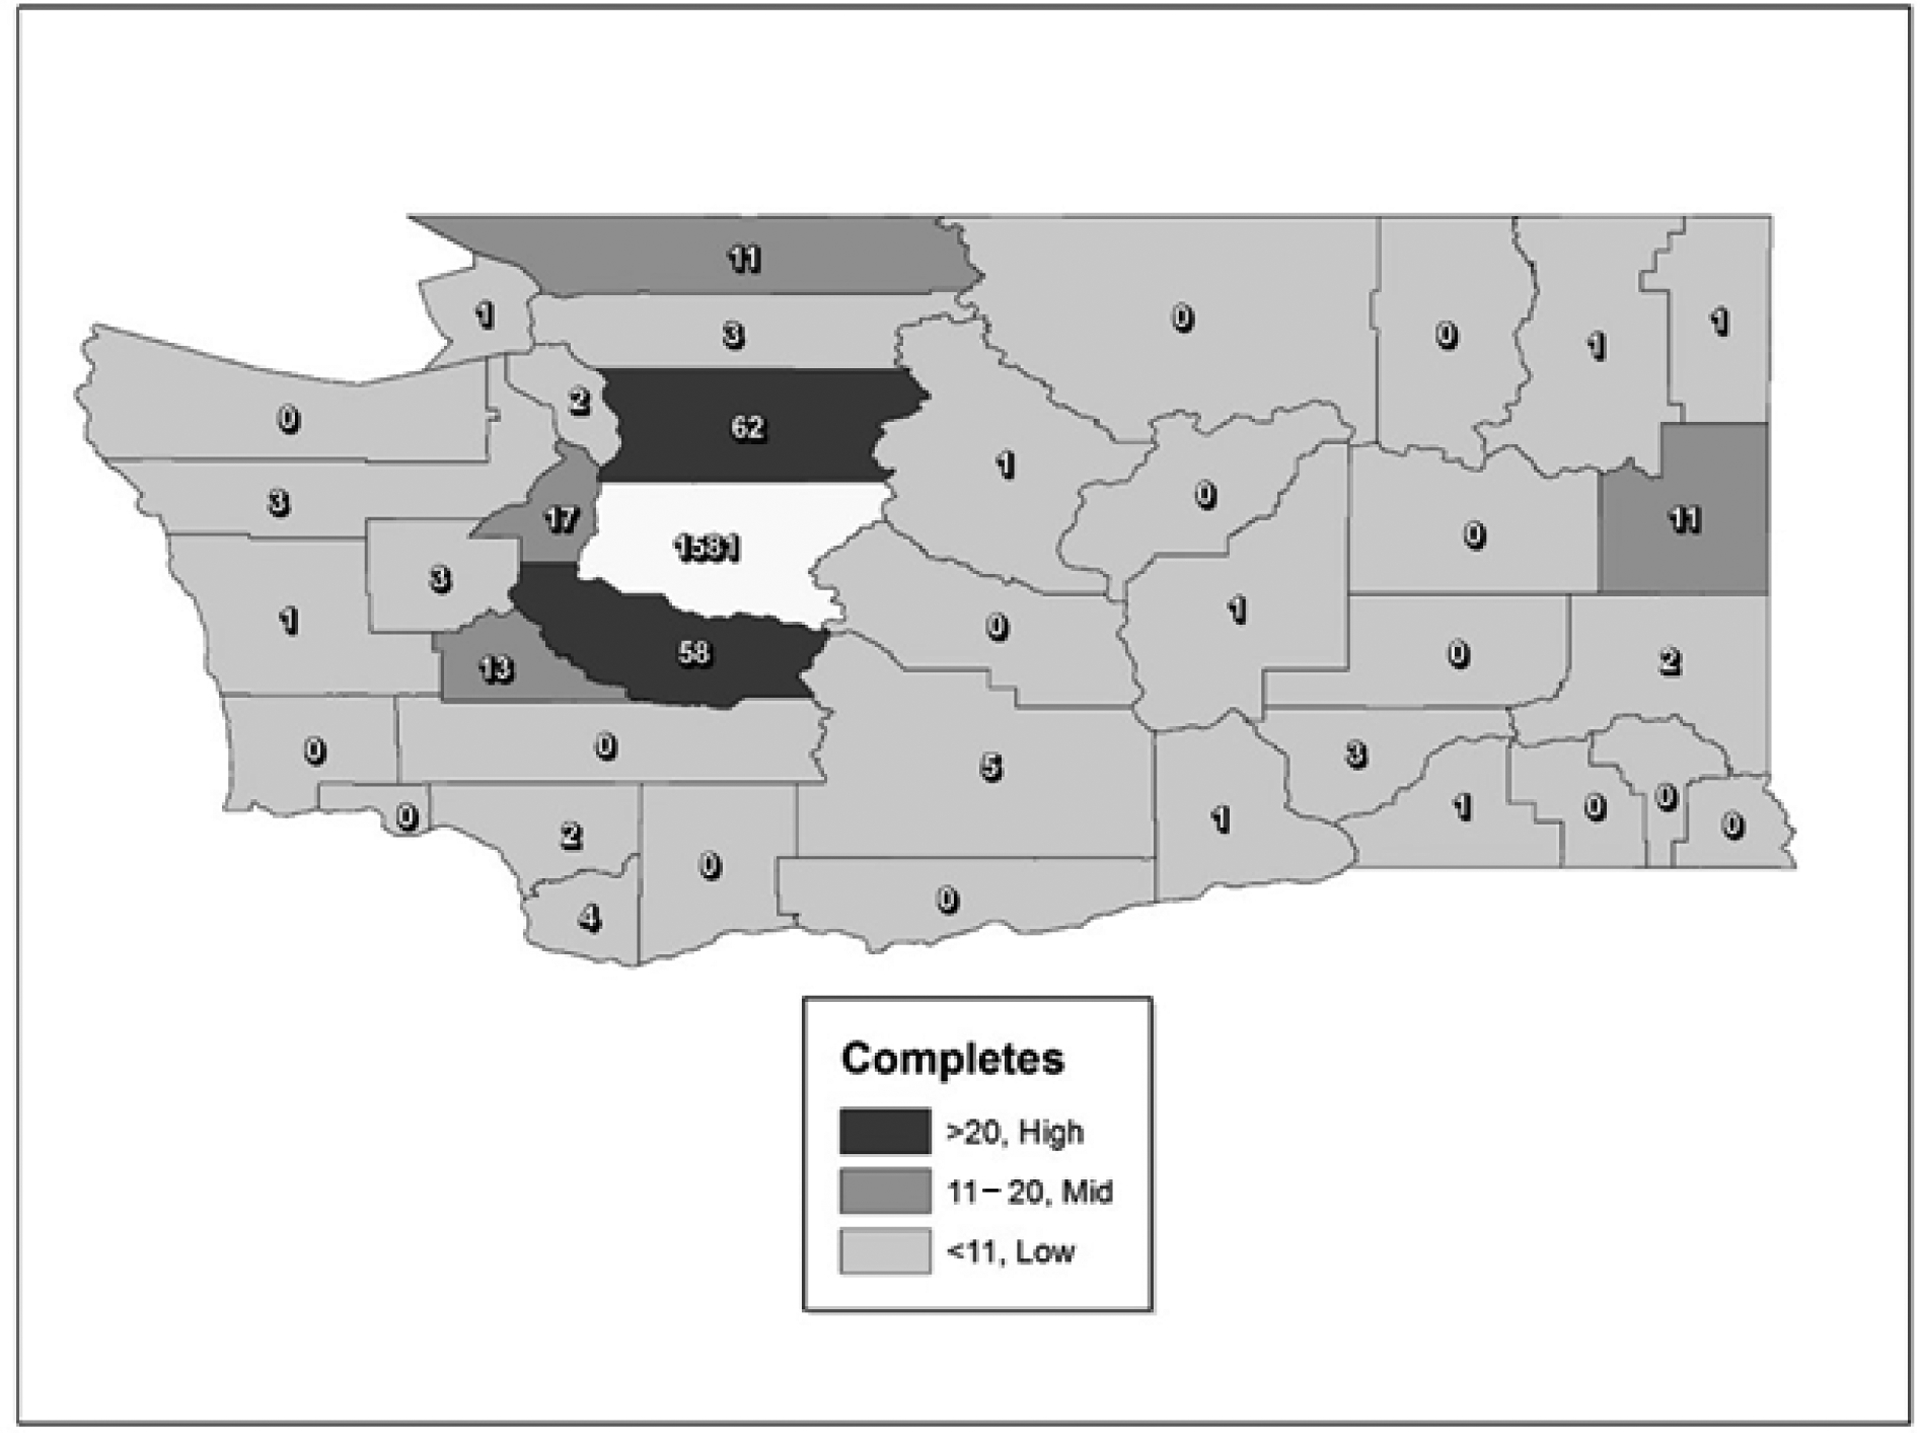
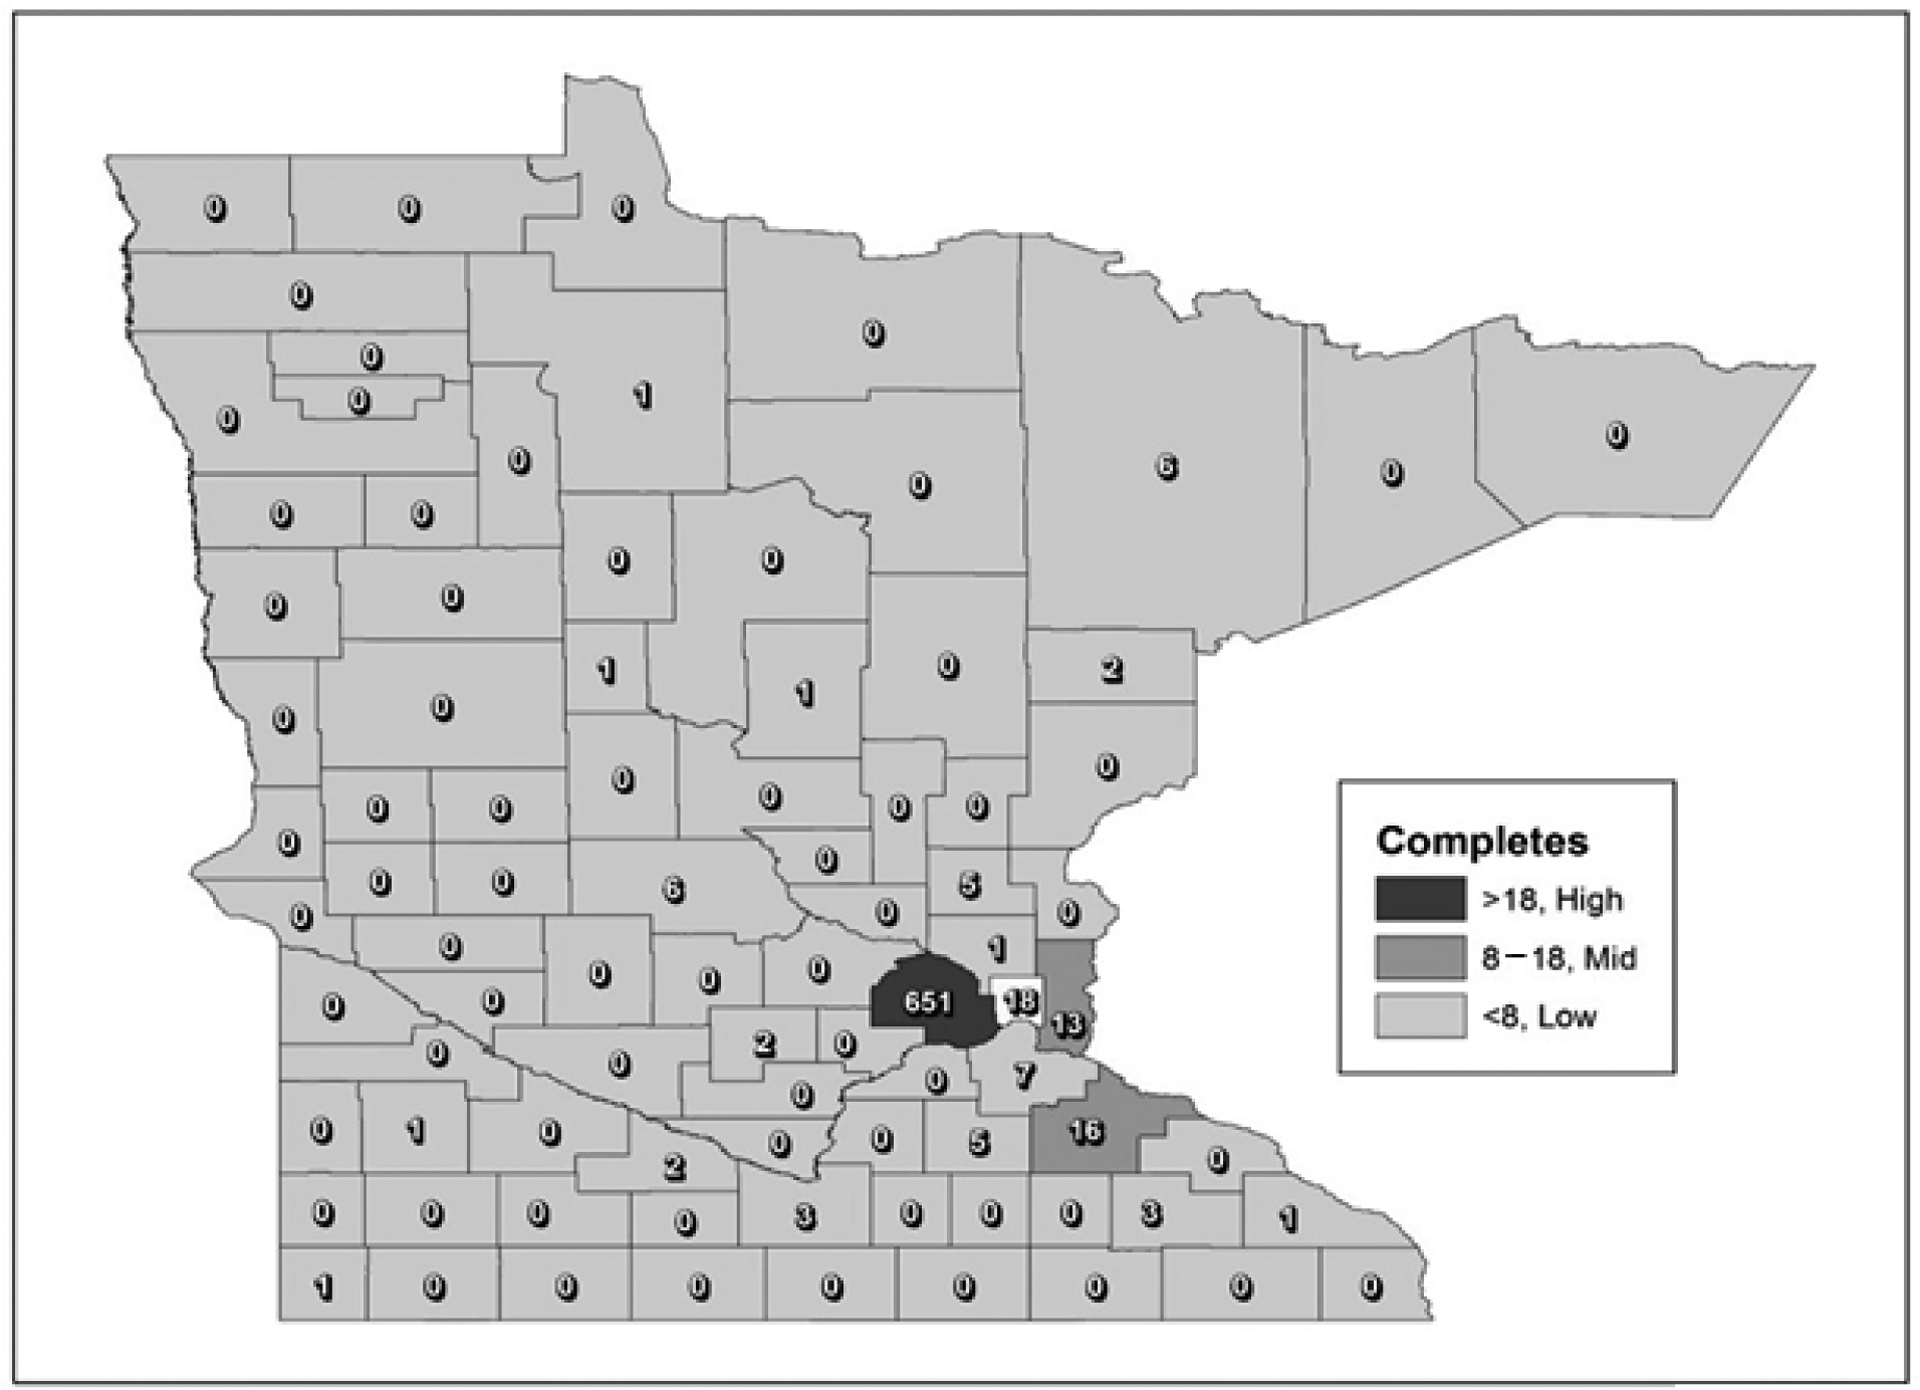
Sample and Respondent Provided County Comparisons Among Cellular Respondents Using Rate Center Assignments
Supporting Files

-
2019
-
File Language:
English
Details
-
Alternative Title:Surv Pract
-
Personal Author:
-
Description:The percentage of cell phones in telephone survey samples continues to grow in proportion to the percentage of potential respondents who rely on cell phones for personal communication. One problem with cell phone samples is that persons who move or who purchase cell phones in locations not close to their residence, may not be eligible for surveys with geographic parameters. This affects researchers' ability to sample and analyze from specific geographic jurisdictions. Because cell phone numbers do not accurately indicate respondent locations, rate centers have been used to ascertain respondent locations in recent years. The Behavioral Risk Factor Surveillance System (BRFSS) is a state-based telephone survey administered to over 400,000 respondents annually. Approximately half of the sample is drawn from cell phone numbers. This research examines the county-level accuracy of the 2016 BRFSS sample. Results indicate that cell phone samples are accurate at the state and county level 58% of the time and at just the state level 93% of the time. However, accuracy rates vary by state, region, metropolitan status as well as by demographic characteristics and survey items. Specific examples of when county-level accuracy vary are provided.
-
Keywords:
-
Source:Surv Pract. 12(1):1-8
-
Pubmed ID:33850670
-
Pubmed Central ID:PMC8040621
-
Document Type:
-
Funding:
-
Volume:12
-
Issue:1
-
Collection(s):
-
Main Document Checksum:urn:sha256:de6653175e0440c271d414c4e54a9c60ecad46b3c66c3b60a249ac5824ea66d4
-
Download URL:
-
File Type:
 [PDF
- 359.35 KB
]
[PDF
- 359.35 KB
]
Supporting Files

File Language:
English
ON THIS PAGE

CDC STACKS serves as an archival repository of CDC-published products including
scientific findings,
journal articles, guidelines, recommendations, or other public health information authored or
co-authored by CDC or funded partners.
As a repository, CDC STACKS retains documents in their original published format to ensure public access to scientific information.
As a repository, CDC STACKS retains documents in their original published format to ensure public access to scientific information.
You May Also Like
COLLECTION
CDC Public Access