
i
1990–2013
-
January 15 2019
Source: Traffic Inj Prev. 20(1):58-63 -
Alternative Title:Traffic Inj Prev
-
Personal Author:
-
Description:Objectives:
Nationally, animal–motor vehicle crashes (AVCs) account for 4.4% of all types of motor vehicle crashes (MVCs). AVCs are a safety risk for drivers and animals and many National Park Service (NPS) units (e.g., national park, national monument, or national parkway) have known AVC risk factors, including rural locations and substantial animal densities. We sought to describe conditions and circumstances involving AVCs to guide traffic and wildlife management for prevention of AVCs in select NPS units.
Methods:
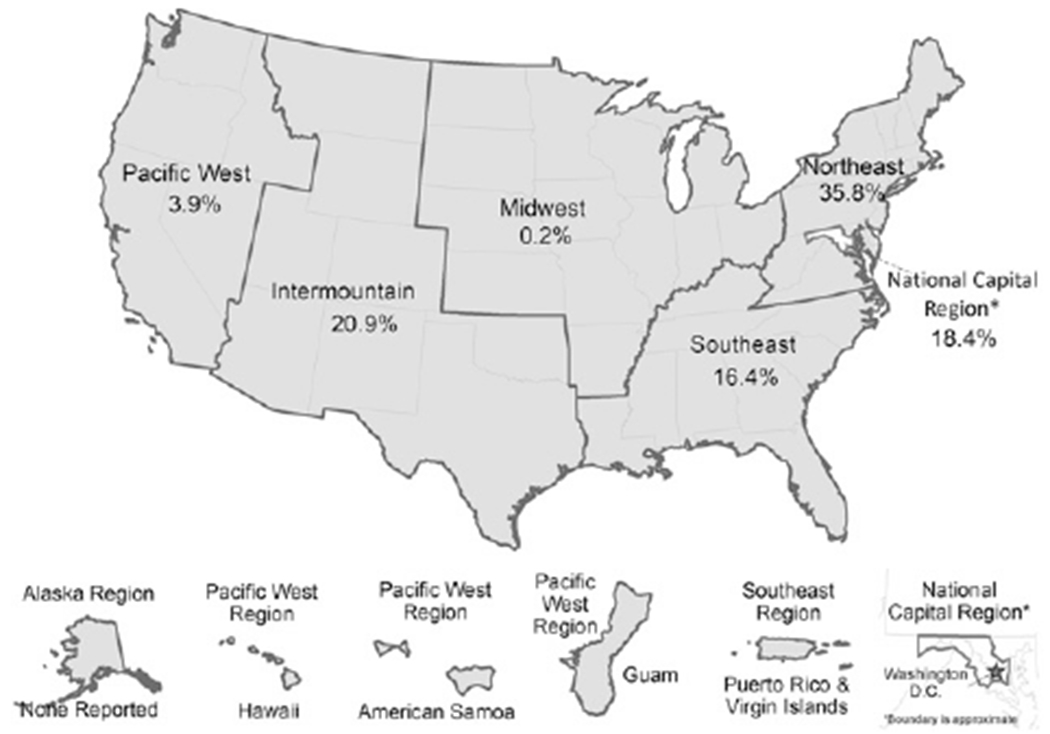
We conducted an analysis using NPS law enforcement MVC data. An MVC is a collision involving an in-transit motor vehicle that occurred or began on a public roadway. An AVC is characterized as a collision between a motor vehicle and an animal. A non-AVC is a crash between a motor vehicle and any object other than an animal or noncollision event (e.g., rollover crash). The final data for analysis included 54,068 records from 51 NPS units during 1990–2013. Counts and proportions were calculated for categorical variables and medians and ranges were calculated for continuous variables. We used Pearson’s chi-square to compare circumstances of AVCs and non-AVCs. Data were compiled at the park regional level; NPS parks are assigned to 1 of 7 regions based on the park’s location.
Results:
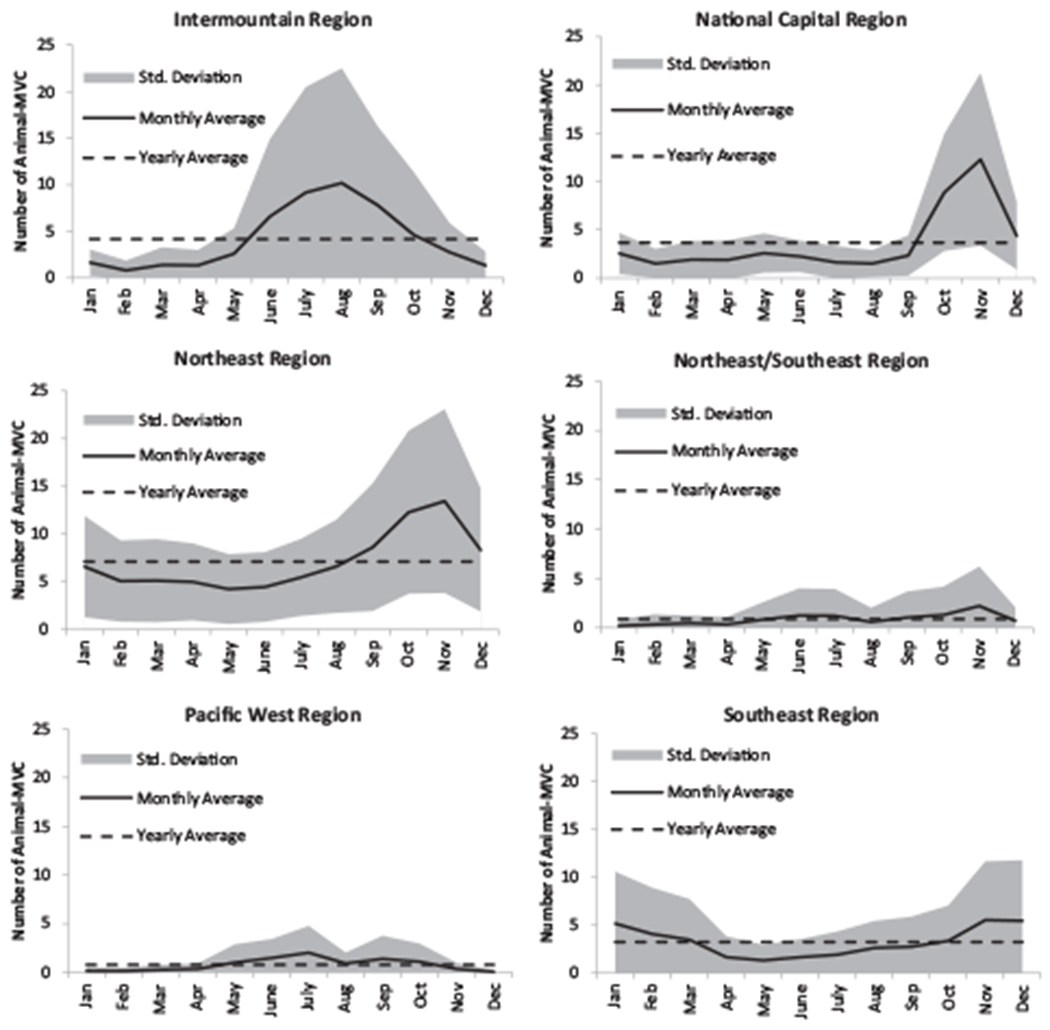
AVCs accounted for 10.4% (5,643 of 54,068) of all MVCs from 51 NPS units. The Northeast (2,021 of 5,643; 35.8%) and Intermountain (1,180 of 5,643; 20.9%) regions had the largest percentage of the total AVC burden. November was the peak month for AVCs across all regions (881 of 5,643; 15.6%); however, seasonality varied by park geographic regions. The highest counts of AVCs were reported during fall for the National Capital, Northeast/Southeast, and Northeast regions; winter for the Southeast region; and summer for Intermountain and Pacific West regions.
Conclusions:
AVCs represent a public health and wildlife safety concern for NPS units. AVCs in select NPS units were approximately 2-fold higher than the national percentage for AVCs. The peak season for AVCs varied by NPS region. Knowledge of region-specific seasonality patterns for AVCs can help NPS staff develop mitigation strategies for use primarily during peak AVC months. Improving AVC data collection might provide NPS with a more complete understanding of risk factors and seasonal trends for specific NPS units. By collecting information concerning the animal species hit, park managers can better understand the impacts of AVC to wildlife population health.
-
Subjects:
-
Source:
-
Pubmed ID:30644778
-
Pubmed Central ID:PMC7027590
-
Document Type:
-
Collection(s):
-
Main Document Checksum:
-
Download URL:
-
File Type:
 [PDF-475.60 KB]
Details:
Supporting Files

More +


 Email
CDC-INFO
Email
CDC-INFO


