
i
Assessment of Anthropometric Data Following Investments to Ensure Quality: Kenya Demographic Health Surveys Case Study, 2008 to 2009 and 2014
-
Jul 23 2018
Source: Food Nutr Bull. 39(3):406-419
 [PDF-557.32 KB]
Details:
-
Alternative Title:Food Nutr Bull
-
Personal Author:
-
Description:Background:
Evidence-based nutrition programs depend on accurate estimates of malnutrition derived from data collected in population representative surveys. The feasibility of obtaining accurate anthropometric data as part of national, multisectoral surveys has been a debated issue.
Objectives:
The study aimed to evaluate changes in anthropometric data quality corresponding to investments by the Kenya Ministry of Health and nutrition sector partners for the 2014 Kenya Demographic Health Survey.
Methods:
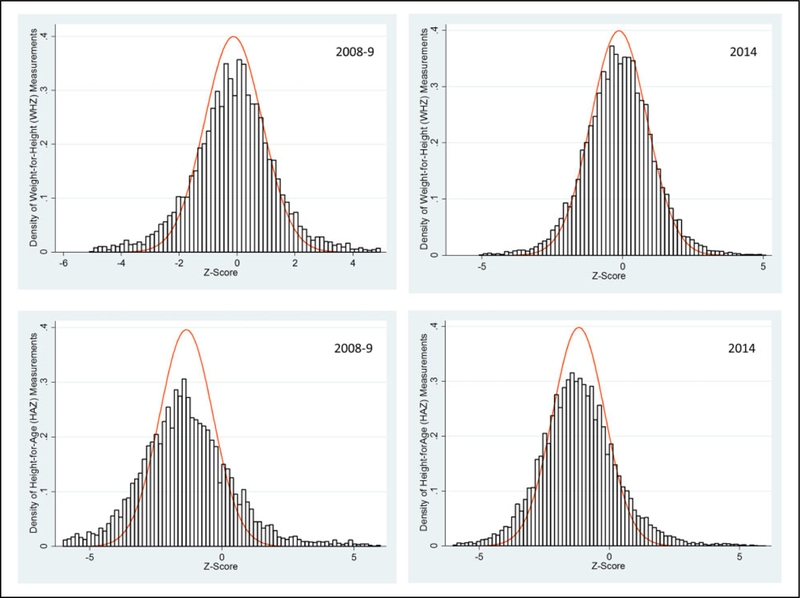
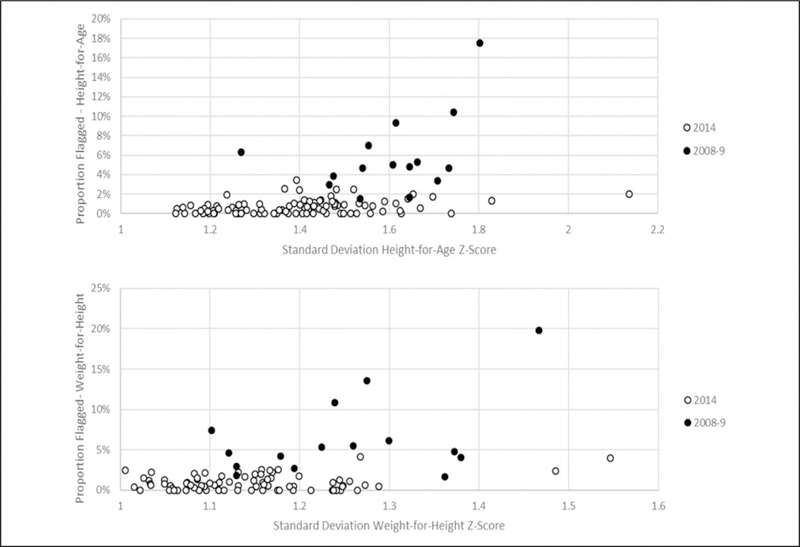
Anthropometric data collected during the 2008 to 2009 and 2014 Kenya surveys were reanalyzed to assess standard parameters of quality: standard deviation, skewness, and kurtosis of z-score values for 3 anthropometric indicators (weight for height, height for age, and weight for age), percentage of children with missing measurements and outlier values, digit preference, and heaping of age.
Results:
A total of 9936 households were selected in 2008 to 2009, and 39 679 households were selected in 2014. Standard deviation of z-scores for all 3 indicators was smaller in 2014 than in 2008 to 2009. Applying original Demographic and Health Survey exclusion criteria, weight for height z-scores were 1.16 in 2014, 10.1% narrower than 2008 to 2009. The percentage of outlying values declined significantly from 2008 to 2009 to 2014 for both height for age and weight for height (P < .001). Digit preference scores in 2014 improved for both weight (P =.011) and height (P < .001) suggesting less rounding of terminal digits.
Conclusions:
All tests of data quality suggest an improvement in 2014 relative to 2008 to 2009, despite the complexity implied by the larger sample. This improvement corresponds with efforts to enhance training and supervision of anthropometry, suggesting a positive effect of these enhancements.
-
Subjects:
-
Source:
-
Pubmed ID:30037280
-
Pubmed Central ID:PMC6327319
-
Document Type:
-
Place as Subject:
-
Collection(s):
-
Main Document Checksum:
-
Download URL:
-
File Type:
Supporting Files


More +
You May Also Like
 [PDF - 1.38 MB]

 Email
CDC-INFO
Email
CDC-INFO


