
i
Geographical, racial and socio-economic variation in life expectancy in the US and their impact on cancer relative survival
-
Jul 25 2018
Source: PLoS One. 13(7). -
Alternative Title:PLoS One
-
Personal Author:
-
Description:Purpose
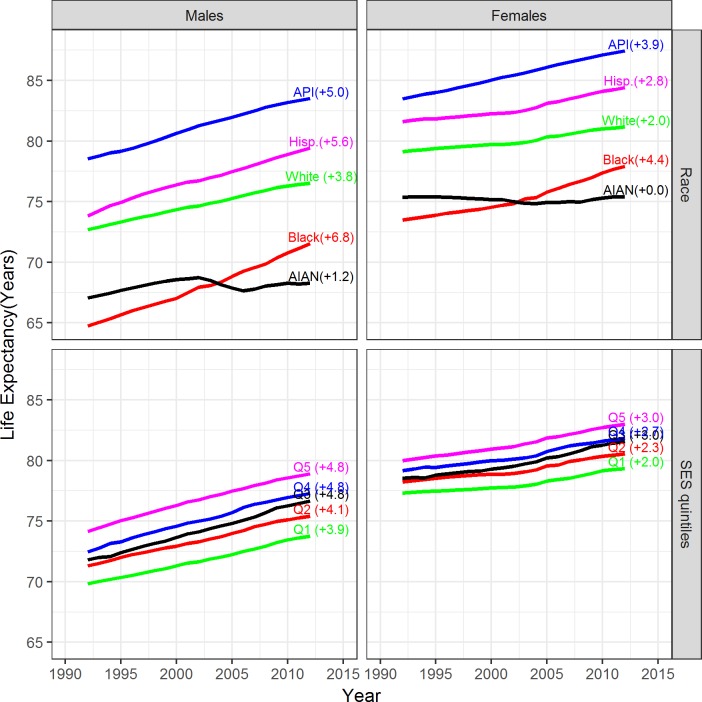
Despite gains in life expectancy between 1992 to 2012, large disparities in life expectancy continue to exist in the United States between subgroups of the population. This study aimed to develop detailed life tables (LT), accounting for mortality differences by race, geography, and socio-economic status (SES), to more accurately measure relative cancer survival and life expectancy patterns in the United States.
Methods
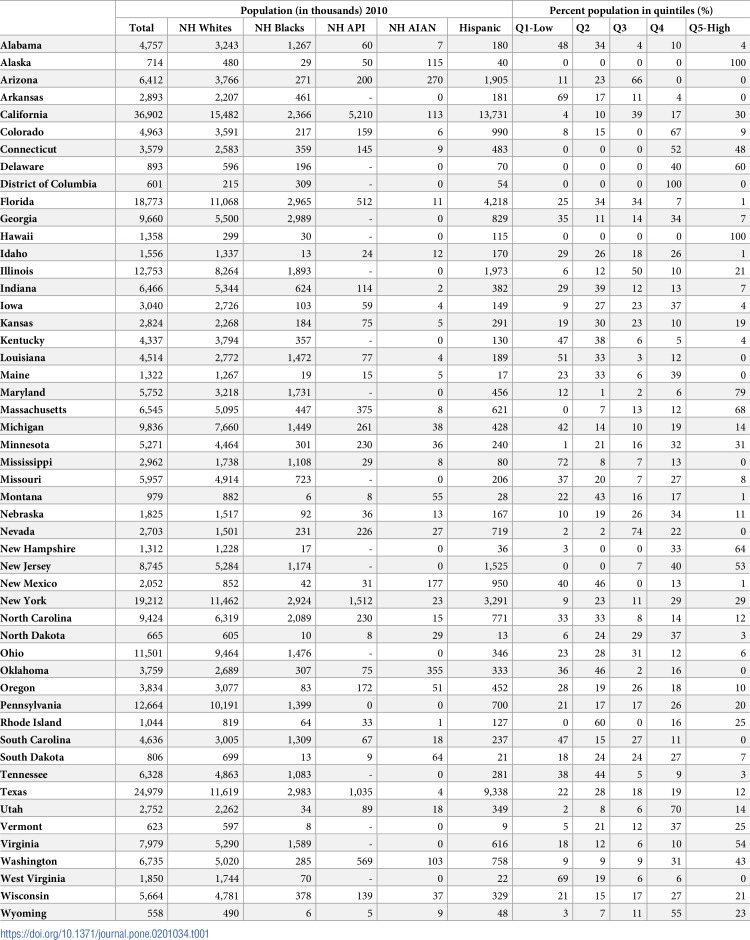
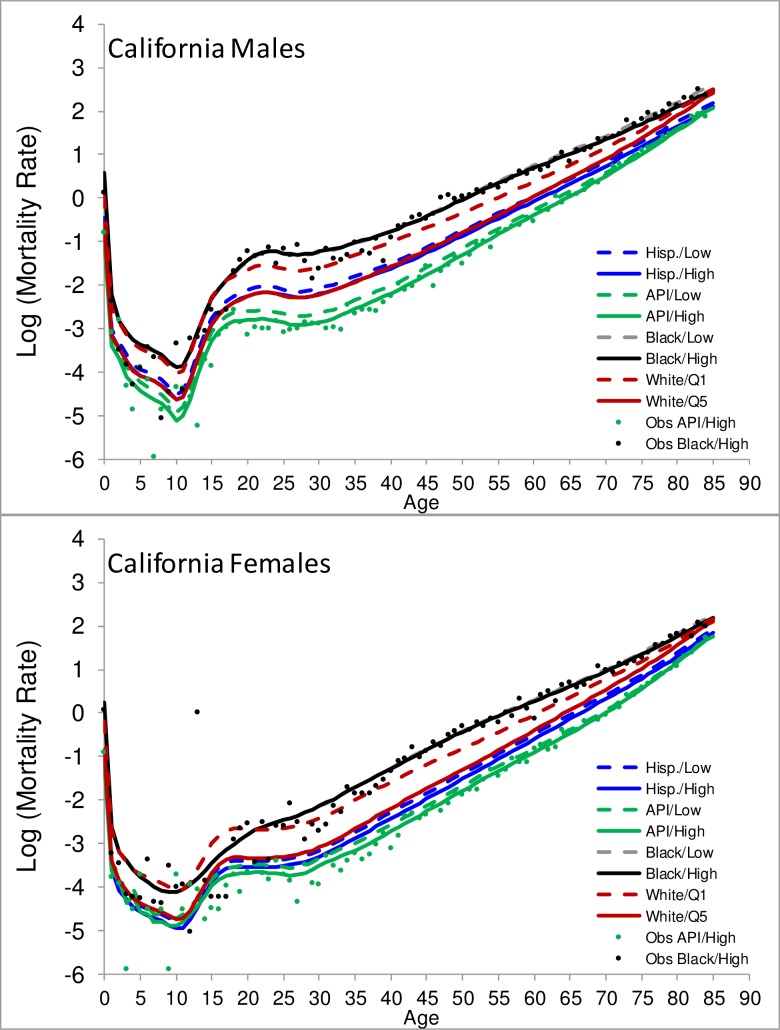
We estimated an extensive set of County SES-LT by fitting Poisson regression models to deaths and population counts for U.S. counties by age, year, gender, race, ethnicity and county-level SES index. We reported life expectancy patterns and evaluated the impact of the County SES-LT on relative survival using data from the Surveillance Epidemiology and End Results (SEER) Program cancer registries.
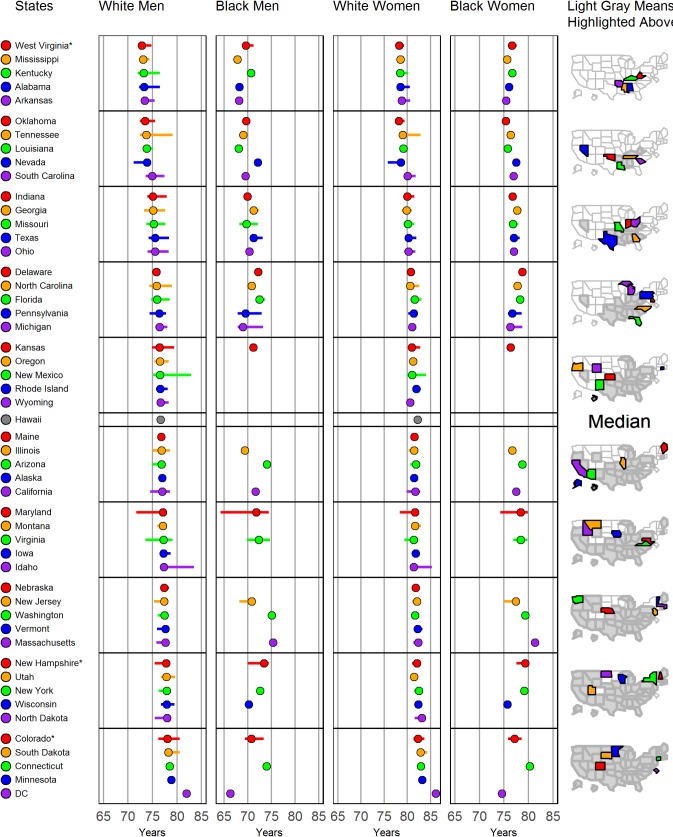
Results
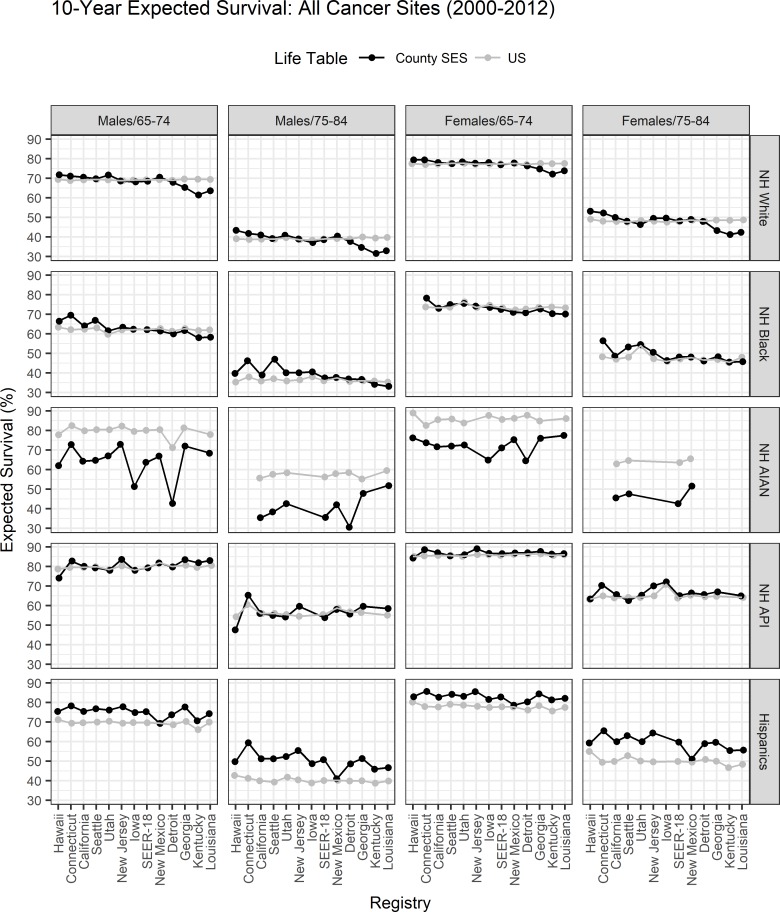
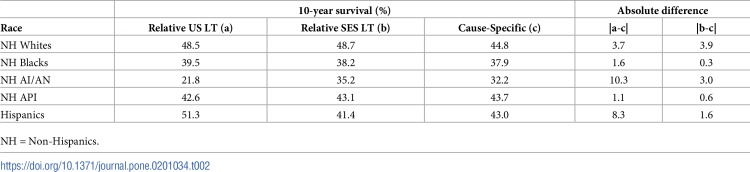
Between 1992 and 2012, the largest increase in life expectancy was among black men (6.8 years), however there were still large geographical differences. Life expectancy was highest for Asian or Pacific Islanders (API), and lowest for American Indians and Alaskan Natives (AIAN). In 2010, life expectancies by state ranged from 73 to 82 years for white males, 78 to 86 years for white females, 66 to 75 for black males, and 75 to 81 for black females. Comparisons of relative survival using National LT and the new County SES-LT showed that relative survival using County SES-LT improved relative survival estimates for some demographic groups, particularly in low and high SES areas, among Hispanics and AIAN, and among older male cancer patients. Relative survival using County SES-LT was 7.3% and 6.7% survival points closer to cause-specific survival compared to the National LT relative survival for AIAN and Hispanic cancer patients diagnosed between ages 75 and 84 years, respectively. Importantly, the County SES-LT relative survival estimates were higher in lower SES areas and lower in higher SES areas, reducing differences in relative survival comparisons.
Conclusion
The use of these new socio-economic life tables (County SES-LT) can provide more accurate estimates of relative survival, improve comparisons of relative survival among registries, better illustrate disparities and cancer control efforts, and should be used as default for cancer relative survival using U.S. data.
-
Subjects:
-
Source:
-
Pubmed ID:30044829
-
Pubmed Central ID:PMC6059474
-
Document Type:
-
Place as Subject:
-
Collection(s):
-
Main Document Checksum:
-
Download URL:
-
File Type:
-

jpeg 
gif 
jpeg 
gif 
jpeg 
gif 
jpeg 
xml 
xlsx 
gif 
jpeg 
jpeg 
gif 
jpeg 
jpeg 
jpeg 
jpeg 
jpeg 
gif 
jpeg 
gif
 [PDF-3.79 MB]
Details:
Supporting Files


More +


 Email
CDC-INFO
Email
CDC-INFO


