
i
The feasibility and utility of grocery receipt analyses for dietary assessment
-
Mar 30 2006
Source: Nutr J. 2006; 5:10.
 [PDF-256.39 KB]
Details:
-
Alternative Title:Nutr J
-
Personal Author:
-
Description:Objective
To establish the feasibility and utility of a simple data collection methodology for dietary assessment.
Design
Using a cross-sectional design, trained data collectors approached adults (~20 – 40 years of age) at local grocery stores and asked whether they would volunteer their grocery receipts and answer a few questions for a small stipend ($1).
Methods
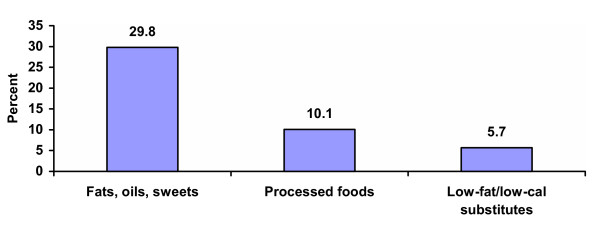
The grocery data were divided into 3 categories: "fats, oils, and sweets," "processed foods," and "low-fat/low-calorie substitutions" as a percentage of the total food purchase price. The questions assessed the shopper's general eating habits (eg, fast-food consumption) and a few demographic characteristics and health aspects (eg, perception of body size).
Results
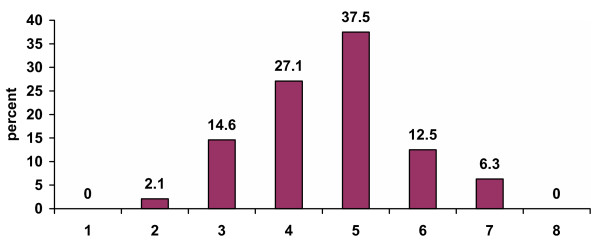
Forty-eight receipts and questionnaires were collected. Nearly every respondent reported eating fast food at least once per month; 27% ate out once or twice a day. Frequency of fast-food consumption was positively related to perceived body size of the respondent (p = 0.02). Overall, 30% of the food purchase price was for fats, oils, sweets, 10% was for processed foods, and almost 6% was for low-fat/low-calorie substitutions. Households where no one was perceived to be overweight spent a smaller proportion of their food budget on fats, oils, and sweets than did households where at least one person was perceived to be overweight (p = 0.10); household where the spouse was not perceived to be overweight spent less on fats, oils, and sweets (p = 0.02) and more on low-fat/low-calorie substitutions (p = 0.09) than did households where the spouse was perceived to be overweight; and, respondents who perceived themselves to be overweight spent more on processed foods than did respondents who did not perceive themselves to be overweight (p = 0.06).
Conclusion
This simple dietary assessment method, although global in nature, may be a useful indicator of dietary practices as evidenced by its association with perceived weight status.
-
Subjects:
-
Source:
-
Document Type:
-
Collection(s):
-
Main Document Checksum:
-
Download URL:
-
File Type:
Supporting Files
-

gif 
jpeg 
gif 
jpeg 
txt
txt

More +
You May Also Like

Giacobbi, Peter
 ;
;
Long, Dustin
...
[PDF - 818.91 KB]

 Email
CDC-INFO
Email
CDC-INFO


