
i
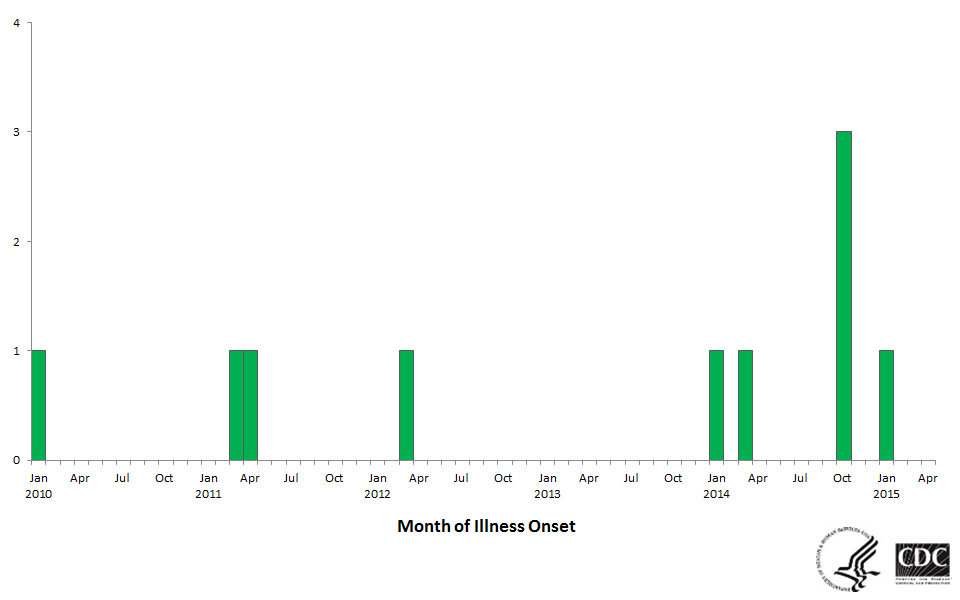
Multistate outbreak of Listeriosis linked to Blue Bell Creameries Ice Cream products epi curve

Details:
-
Corporate Authors:
-
Description:As of April 21, 2015, a total of ten patients infected with several strains of Listeria monocytogenes were reported from four states: Arizona (1), Kansas (5), Oklahoma (1), and Texas (3). Illness onset dates ranged from January 2010 through January 2015. The patients with illness onsets ranging from 2010-2014 were identified through a retrospective review of the PulseNet database for DNA fingerprints that were similar to isolates collected from Blue Bell ice cream samples. Since the last update on April 8, 2015, two additional patients, one each from Arizona and Oklahoma, were confirmed to be a part of the outbreak by whole genome sequencing. All ten (100%) patients were hospitalized. Three deaths were reported from Kansas.
One additional isolate from a patient with listeriosis is undergoing further molecular laboratory testing to determine whether this illness may be related to this outbreak. Results of this testing will be reported once they are available. CDC and state and local public health partners are continuing laboratory surveillance through PulseNet to identify any other ill persons that may be part of this outbreak.
This outbreak can be visually described with a chart showing the number of persons who were diagnosed each month. This chart is called an epi curve.
-
Subjects:
-
Document Type:
-
Genre:
-
Collection(s):
-
Main Document Checksum:
-
Download URL:
-
File Type:
Supporting Files
-
No Additional Files
More +
You May Also Like


 Email
CDC-INFO
Email
CDC-INFO


