
i
Analysis of tuberculosis prevalence surveys: new guidance on best-practice methods
-
Sep 28 2013
Source: Emerg Themes Epidemiol. 2013; 10:10. -
Alternative Title:Emerg Themes Epidemiol
-
Personal Author:
-
Description:Background
An unprecedented number of nationwide tuberculosis (TB) prevalence surveys will be implemented between 2010 and 2015, to better estimate the burden of disease caused by TB and assess whether global targets for TB control set for 2015 are achieved. It is crucial that results are analysed using best-practice methods.
Objective
To provide new theoretical and practical guidance on best-practice methods for the analysis of TB prevalence surveys, including analyses at the individual as well as cluster level and correction for biases arising from missing data.
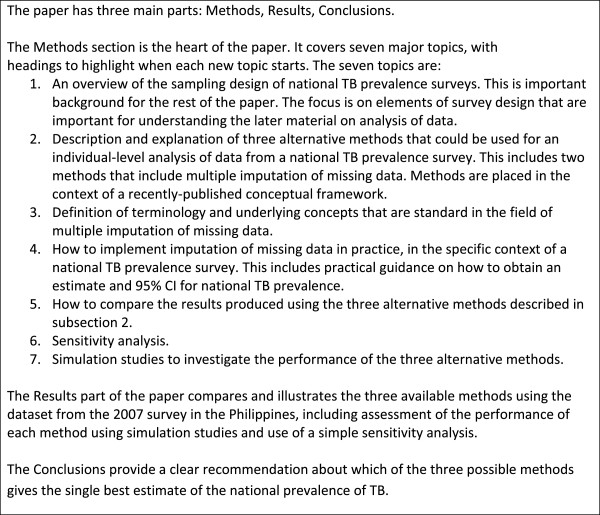
Analytic methods
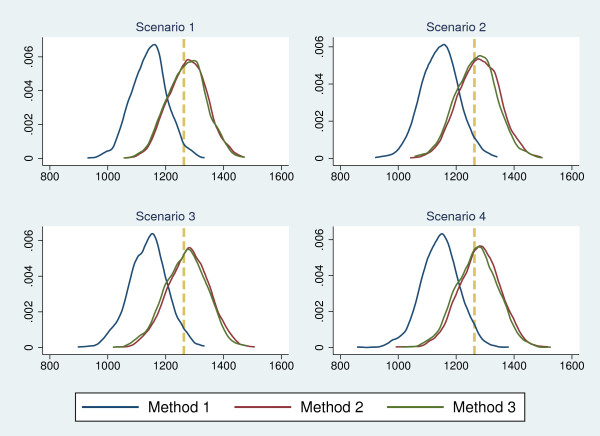
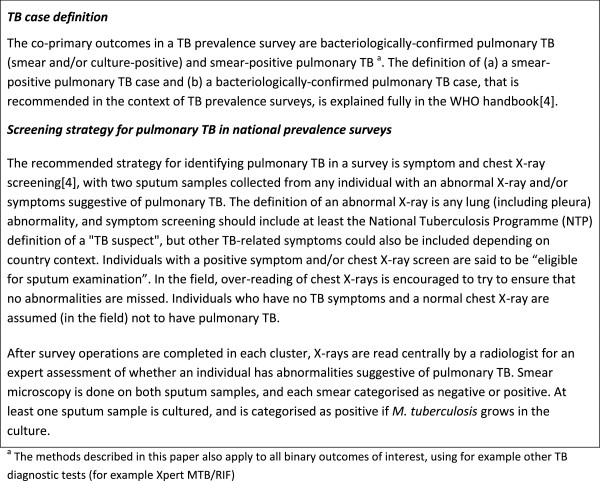
TB prevalence surveys have a cluster sample survey design; typically 50-100 clusters are selected, with 400-1000 eligible individuals in each cluster. The strategy recommended by the World Health Organization (WHO) for diagnosing pulmonary TB in a nationwide survey is symptom and chest X-ray screening, followed by smear microscopy and culture examinations for those with an abnormal X-ray and/or TB symptoms. Three possible methods of analysis are described and explained. Method 1 is restricted to participants, and individuals with missing data on smear and/or culture results are excluded. Method 2 includes all eligible individuals irrespective of participation, through multiple missing value imputation. Method 3 is restricted to participants, with multiple missing value imputation for individuals with missing smear and/or culture results, and inverse probability weighting to represent all eligible individuals. The results for each method are then compared and illustrated using data from the 2007 national TB prevalence survey in the Philippines. Simulation studies are used to investigate the performance of each method.
Key findings
A cluster-level analysis, and Methods 1 and 2, gave similar prevalence estimates (660 per 100,000 aged ≥ 10 years old), with a higher estimate using Method 3 (680 per 100,000). Simulation studies for each of 4 plausible scenarios show that Method 3 performs best, with Method 1 systematically underestimating TB prevalence by around 10%.
Conclusion
Both cluster-level and individual-level analyses should be conducted, and individual-level analyses should be conducted both with and without multiple missing value imputation. Method 3 is the safest approach to correct the bias introduced by missing data and provides the single best estimate of TB prevalence at the population level.
-
Subjects:
-
Document Type:
-
Collection(s):
-
Main Document Checksum:
-
Download URL:
-
File Type:
-

gif 
jpeg 
gif 
jpeg 
gif 
jpeg 
doc 
txt 
gif
txt 
jpeg 
gif 
jpeg 
gif 
jpeg 
gif 
jpeg
 [PDF-3.48 MB]
Details:
Supporting Files


More +
You May Also Like
 [PDF - 312.97 KB]

 Email
CDC-INFO
Email
CDC-INFO


