
i
Trends in Trans Fatty Acids Reformulations of US Supermarket and Brand-Name Foods From 2007 Through 2011
-
May 23 2013
Source: Prev Chronic Dis. 10.
 [PDF-334.45 KB]
Details:
-
Alternative Title:Prev Chronic Dis
-
Personal Author:
-
Description:Introduction
Although some US food manufacturers have reduced trans fatty acids (TFA) in their products, it is unknown how much TFA is being reduced, whether pace of reformulation has changed over time, or whether reformulations vary by food type or manufacturer.
Methods
In 2007, we identified 360 brand-name products in major US supermarkets that contained 0.5 g TFA or more per serving. In 2008, 2010, and 2011, product labels were re-examined to determine TFA content; ingredients lists were also examined in 2011 for partially hydrogenated vegetable oils (PHVO). We assessed changes in TFA content among the 270 products sold in all years between 2007 and 2011 and conducted sensitivity analyses on the 90 products discontinued after 2007.
Results
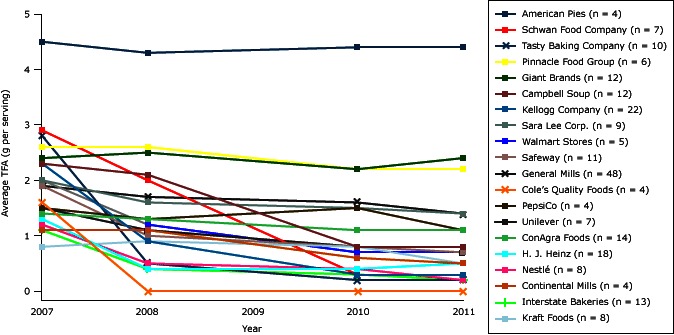
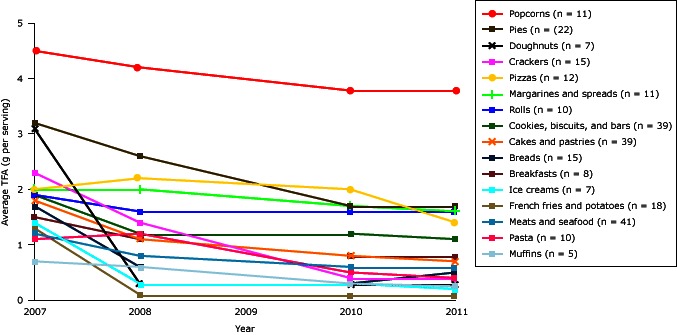
By 2011, 178 (66%) of the 270 products had reduced TFA content. Most reformulated products (146 of 178, 82%) reduced TFA to less than 0.5 g per serving, although half of these 146 still contained PHVO. Among all 270 products, mean TFA content decreased 49% between 2007 and 2011, from 1.9 to 0.9 g per serving. Yet, mean TFA reduction slowed over time, from 30.3% (2007–2008) to 12.1% (2008–2010) to 3.4% (2010–2011) (P value for trend < .001). This slowing pace was due to both fewer reformulations among TFA-containing products at start of each period and smaller TFA reductions among reformulated products. Reformulations also varied substantially by both food category and manufacturer, with some eliminating or nearly eliminating TFA and others showing no significant changes. Sensitivity analyses were similar to main findings.
Conclusions
Some US products and food manufacturers have made progress in reducing TFA, but substantial variation exists by food type and by parent company, and overall progress has significantly slowed over time. Because TFA consumption is harmful even at low levels, our results emphasize the need for continued efforts toward reformulating or discontinuing foods to eliminate PHVO.
-
Subjects:
-
Source:
-
Document Type:
-
Place as Subject:
-
Location:
-
Collection(s):
-
Main Document Checksum:
-
Download URL:
-
File Type:
Supporting Files
-

gif 
jpeg 
doc
doc 
txt
txt 
gif 
jpeg 
gif 
jpeg

More +


 Email
CDC-INFO
Email
CDC-INFO


