
i
Using Secure Web Services to Visualize Poison Center Data for Nationwide Biosurveillance: A Case Study
-
Apr 09 2010
Source: Online J Public Health Inform. 2010; 2(1).
 [PDF-1.28 MB]
Details:
-
Alternative Title:Online J Public Health Inform
-
Personal Author:
-
Description:Objectives
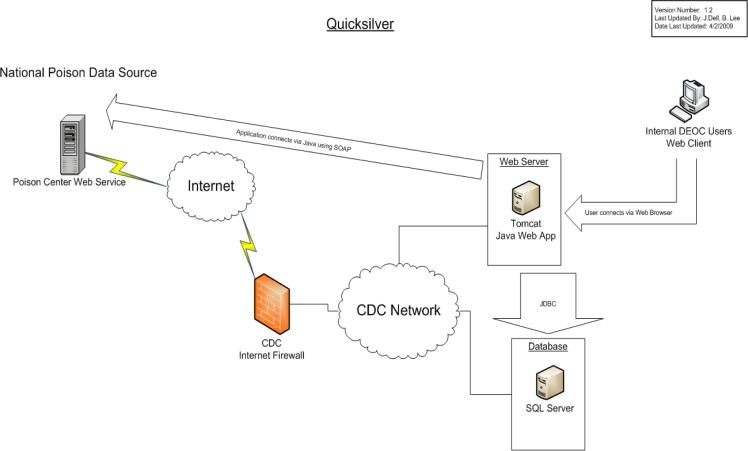
Real-time surveillance systems are valuable for timely response to public health emergencies. It has been challenging to leverage existing surveillance systems in state and local communities, and, using a centralized architecture, add new data sources and analytical capacity. Because this centralized model has proven to be difficult to maintain and enhance, the US Centers for Disease Control and Prevention (CDC) has been examining the ability to use a federated model based on secure web services architecture, with data stewardship remaining with the data provider.
Methods
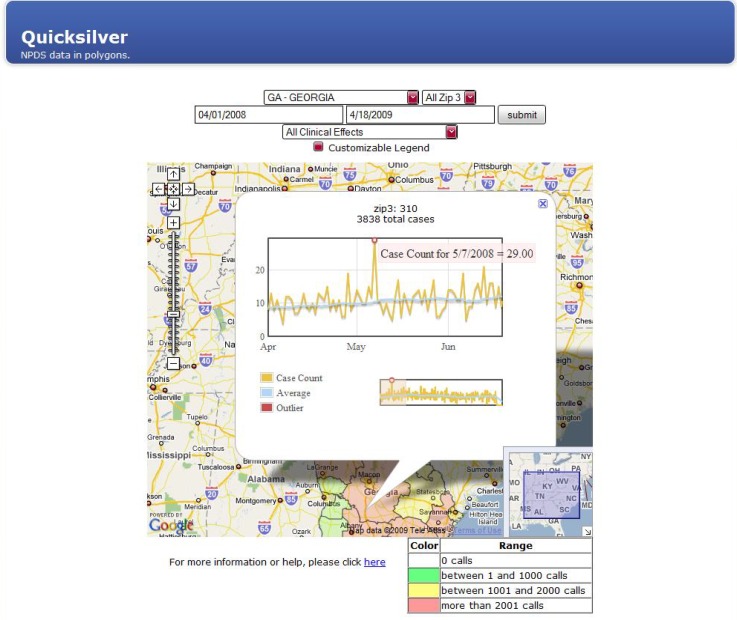
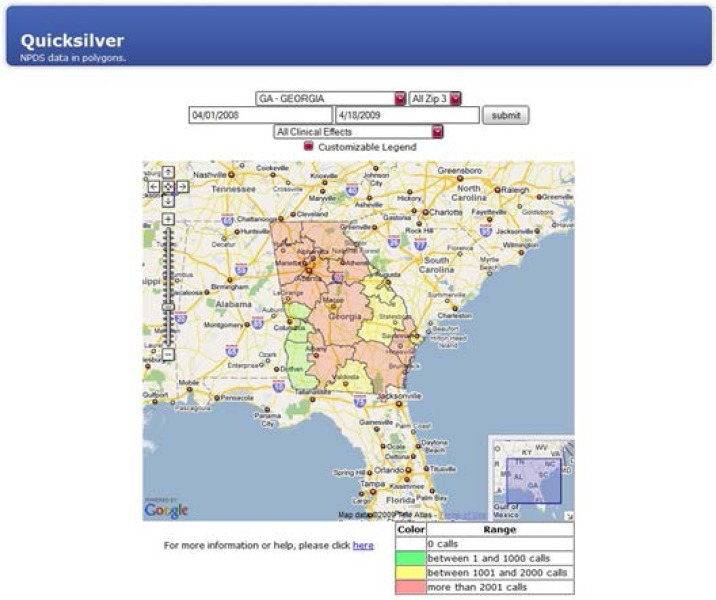
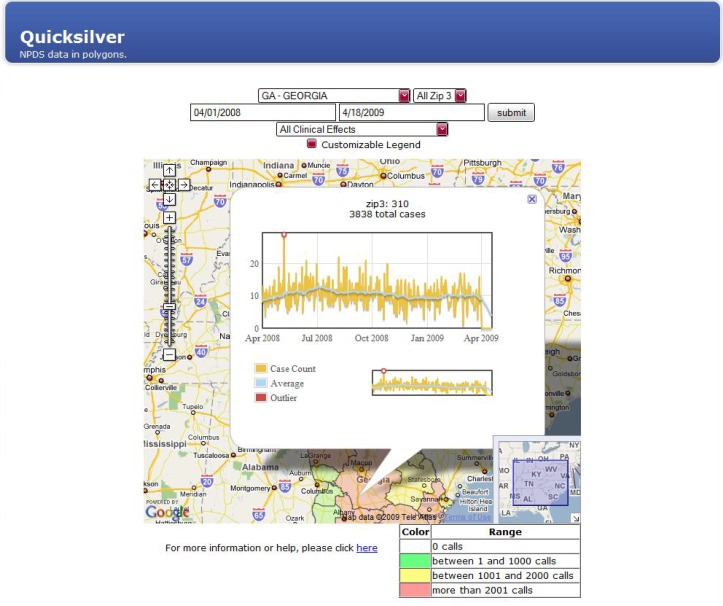
As a case study for this approach, the American Association of Poison Control Centers and the CDC extended an existing data warehouse via a secure web service, and shared aggregate clinical effects and case counts data by geographic region and time period. To visualize these data, CDC developed a web browser-based interface, Quicksilver, which leveraged the Google Maps API and Flot, a javascript plotting library.
Results
Two iterations of the NPDS web service were completed in 12 weeks. The visualization client, Quicksilver, was developed in four months.
Discussion
This implementation of web services combined with a visualization client represents incremental positive progress in transitioning national data sources like BioSense and NPDS to a federated data exchange model.
Conclusion
Quicksilver effectively demonstrates how the use of secure web services in conjunction with a lightweight, rapidly deployed visualization client can easily integrate isolated data sources for biosurveillance.
-
Subjects:
-
Document Type:
-
Collection(s):
-
Main Document Checksum:
-
Download URL:
-
File Type:
Supporting Files
-

gif 
jpeg 
txt
txt 
gif 
jpeg 
gif 
jpeg 
gif 
jpeg


More +
You May Also Like

 [PDF - 346.50 KB]
 Email
CDC-INFO
Email
CDC-INFO


