
i
Statistical air quality predictions for public health surveillance: evaluation and generation of county level metrics of PM2.5 for the environmental public health tracking network
-
Mar 14 2013
Source: Int J Health Geogr. 2013; 12:12. -
Alternative Title:Int J Health Geogr
-
Personal Author:
-
Description:Background
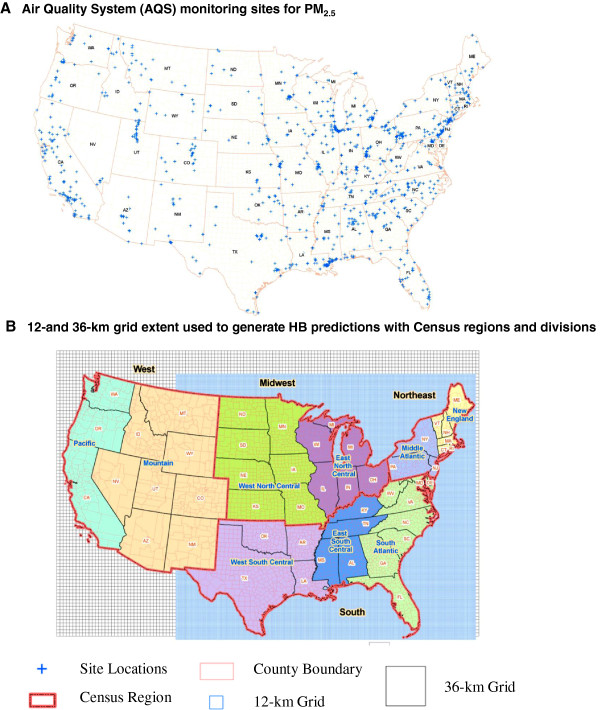
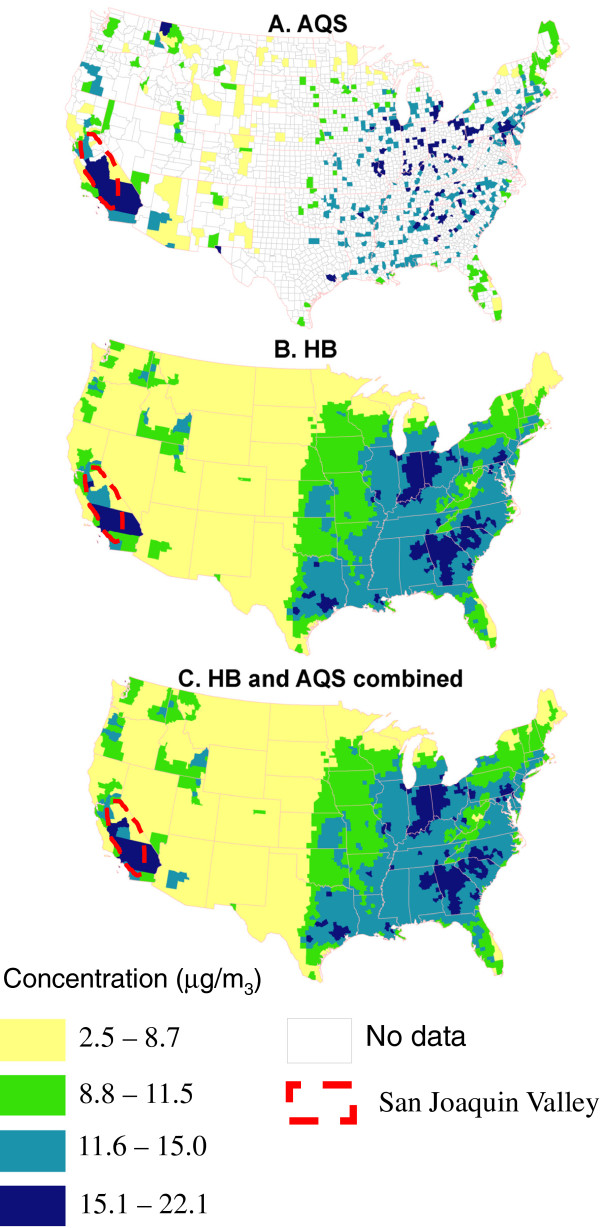
The Centers for Disease Control and Prevention (CDC) developed county level metrics for the Environmental Public Health Tracking Network (Tracking Network) to characterize potential population exposure to airborne particles with an aerodynamic diameter of 2.5 μm or less (PM2.5). These metrics are based on Federal Reference Method (FRM) air monitor data in the Environmental Protection Agency (EPA) Air Quality System (AQS); however, monitor data are limited in space and time. In order to understand air quality in all areas and on days without monitor data, the CDC collaborated with the EPA in the development of hierarchical Bayesian (HB) based predictions of PM2.5 concentrations. This paper describes the generation and evaluation of HB-based county level estimates of PM2.5.
Methods
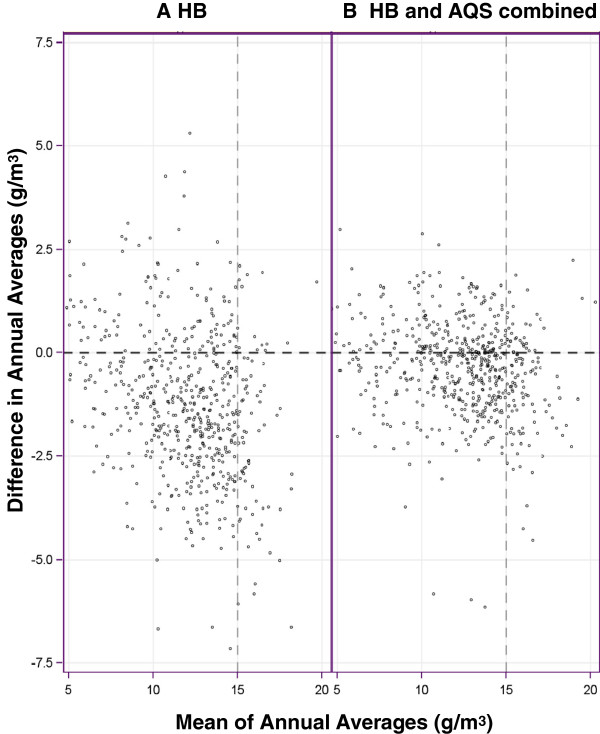
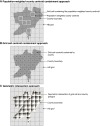
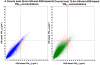
We used three geo-imputation approaches to convert grid-level predictions to county level estimates. We used Pearson (r) and Kendall Tau-B (τ) correlation coefficients to assess the consistency of the relationship, and examined the direct differences (by county) between HB-based estimates and AQS-based concentrations at the daily level. We further compared the annual averages using Tukey mean-difference plots.
Results
During the year 2005, fewer than 20% of the counties in the conterminous United States (U.S.) had PM2.5 monitoring and 32% of the conterminous U.S. population resided in counties with no AQS monitors. County level estimates resulting from population-weighted centroid containment approach were correlated more strongly with monitor-based concentrations (r = 0.9; τ = 0.8) than were estimates from other geo-imputation approaches. The median daily difference was −0.2 μg/m3 with an interquartile range (IQR) of 1.9 μg/m3 and the median relative daily difference was −2.2% with an IQR of 17.2%. Under-prediction was more prevalent at higher concentrations and for counties in the western U.S.
Conclusions
While the relationship between county level HB-based estimates and AQS-based concentrations is generally good, there are clear variations in the strength of this relationship for different regions of the U.S. and at various concentrations of PM2.5. This evaluation suggests that population-weighted county centroid containment method is an appropriate geo-imputation approach, and using the HB-based PM2.5 estimates to augment gaps in AQS data provides a more spatially and temporally consistent basis for calculating the metrics deployed on the Tracking Network.
-
Subjects:
-
Source:
-
Document Type:
-
Place as Subject:
-
Collection(s):
-
Main Document Checksum:
-
Download URL:
-
File Type:
-

gif 
jpeg 
txt
txt 
gif 
jpeg 
gif 
jpeg 
gif 
jpeg 
gif 
jpeg
 [PDF-2.38 MB]
Details:
Supporting Files


More +


 Email
CDC-INFO
Email
CDC-INFO


