
i
Urinary Creatinine Concentrations in the U.S. Population: Implications for Urinary Biologic Monitoring Measurements
-
Feb 2005
Source: Environ Health Perspect. ; 113(2):192-200.
 [PDF-226.58 KB]
Details:
-
Alternative Title:Environ Health Perspect
-
Personal Author:
-
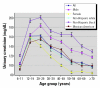
Description:Biologic monitoring (i.e., biomonitoring) is used to assess human exposures to environmental and workplace chemicals. Urinary biomonitoring data typically are adjusted to a constant creatinine concentration to correct for variable dilutions among spot samples. Traditionally, this approach has been used in population groups without much diversity. The inclusion of multiple demographic groups in studies using biomonitoring for exposure assessment has increased the variability in the urinary creatinine levels in these study populations. Our objectives were to document the normal range of urinary creatinine concentrations among various demographic groups, evaluate the impact that variations in creatinine concentrations can have on classifying exposure status of individuals in epidemiologic studies, and recommend an approach using multiple regression to adjust for variations in creatinine in multivariate analyses. We performed a weighted multivariate analysis of urinary creatinine concentrations in 22,245 participants of the Third National Health and Nutrition Examination Survey (1988-1994) and established reference ranges (10th-90th percentiles) for each demographic and age category. Significant predictors of urinary creatinine concentration included age group, sex, race/ethnicity, body mass index, and fat-free mass. Time of day that urine samples were collected made a small but statistically significant difference in creatinine concentrations. For an individual, the creatinine-adjusted concentration of an analyte should be compared with a "reference" range derived from persons in a similar demographic group (e.g., children with children, adults with adults). For multiple regression analysis of population groups, we recommend that the analyte concentration (unadjusted for creatinine) should be included in the analysis with urinary creatinine added as a separate independent variable. This approach allows the urinary analyte concentration to be appropriately adjusted for urinary creatinine and the statistical significance of other variables in the model to be independent of effects of creatinine concentration.
-
Subjects:
-
Document Type:
-
Place as Subject:
-
Collection(s):
-
Main Document Checksum:
-
Download URL:
-
File Type:
Supporting Files
-

txt 
gif 
jpeg
txt

More +
You May Also Like
 [PDF - 1.00 MB]
 [PDF - 526.87 KB]
 Email
CDC-INFO
Email
CDC-INFO


